



Close Menu
Techora News HubTechora News Hub
    Facebook X (Twitter) Instagram
    Techora News HubTechora News Hub
    • Home
    • Crypto News
      • Bitcoin
      • Ethereum
      • Altcoins
      • Blockchain
      • DeFi
    • AI News
    • Stock News
    • Learn
      • AI for Beginners
      • AI Tips
      • Make Money with AI
    • Reviews
    • Tools
      • Best AI Tools
      • Crypto Market Cap List
      • Stock Market Overview
      • Market Heatmap
    • Contact
    Techora News HubTechora News Hub
    Home»Crypto News»Bitcoin»Bitcoin Trader Says ‘It’s 2022 Again’ As RSI Offers A Classic Bull Signal
    Bitcoin

    Bitcoin Trader Says ‘It’s 2022 Again’ As RSI Offers A Classic Bull Signal

    June 29, 2026
    Facebook Twitter Pinterest Telegram LinkedIn Tumblr WhatsApp Email
    Cointelegraph
    Share
    Facebook Twitter LinkedIn Pinterest Telegram Email
    kraken


    Bitcoin (BTC) continued its battle to reclaim $60,000 into the weekend as chart cues fueled hopes of a recovery. 

    Key points:

    • Bitcoin RSI signals spark comparisons to the end of the 2022 bear market as a bullish divergence filters through.
    • Analysis sees “encouraging” evidence of buyers defending the market at $60,000.
    • Some traders still see new lows coming, but these could take until August.

    Analysis on Bitcoin RSI: “It’s 2022 again”

    Data from TradingView showed BTC/USD cooling volatility after returning above the $60,000 mark.

    BTC/USD one-hour chart. Source: Cointelegraph/TradingView

    aistudios

    A series of higher swing lows on hourly time frames combined with encouraging readings from the relative strength index (RSI) indicator.

    On the four-hour chart, a bullish divergence was occurring, where RSI makes higher lows while price makes lower lows. This caught the attention of market participants, who began to anticipate a BTC price reversal as a result.

    Uploading a chart comparing the current bear market with 2022, pseudonymous trader Rod argued that history was repeating itself.

    “Once you see it, you can’t unsee it,” they wrote in a post on X. 

    “It’s 2022 again.”
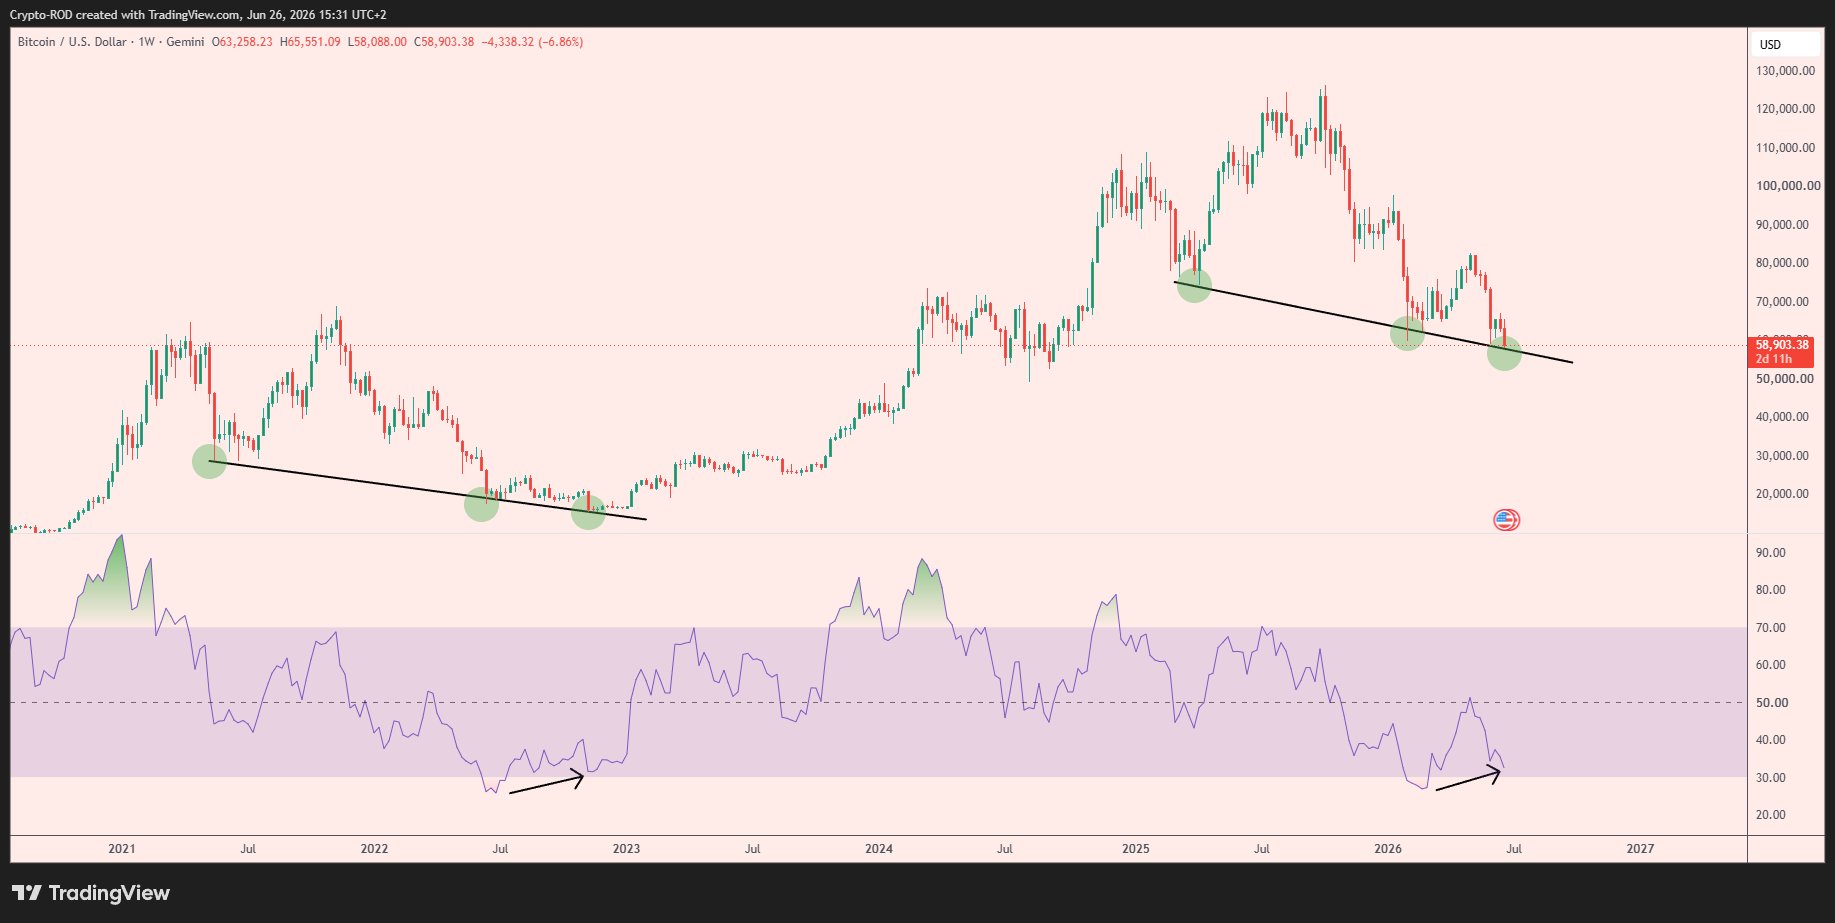
    BTC/USD one-week chart with RSI data. Source: Rod/X

    At the time, a weekly RSI bullish divergence kicked in while BTC/USD set its bear-market low of $15,600 — an event that subsequently provided a durable market floor.

    Four-hour RSI, meanwhile, fell to just 11.4 at the start of June, marking one of its lowest levels on record.
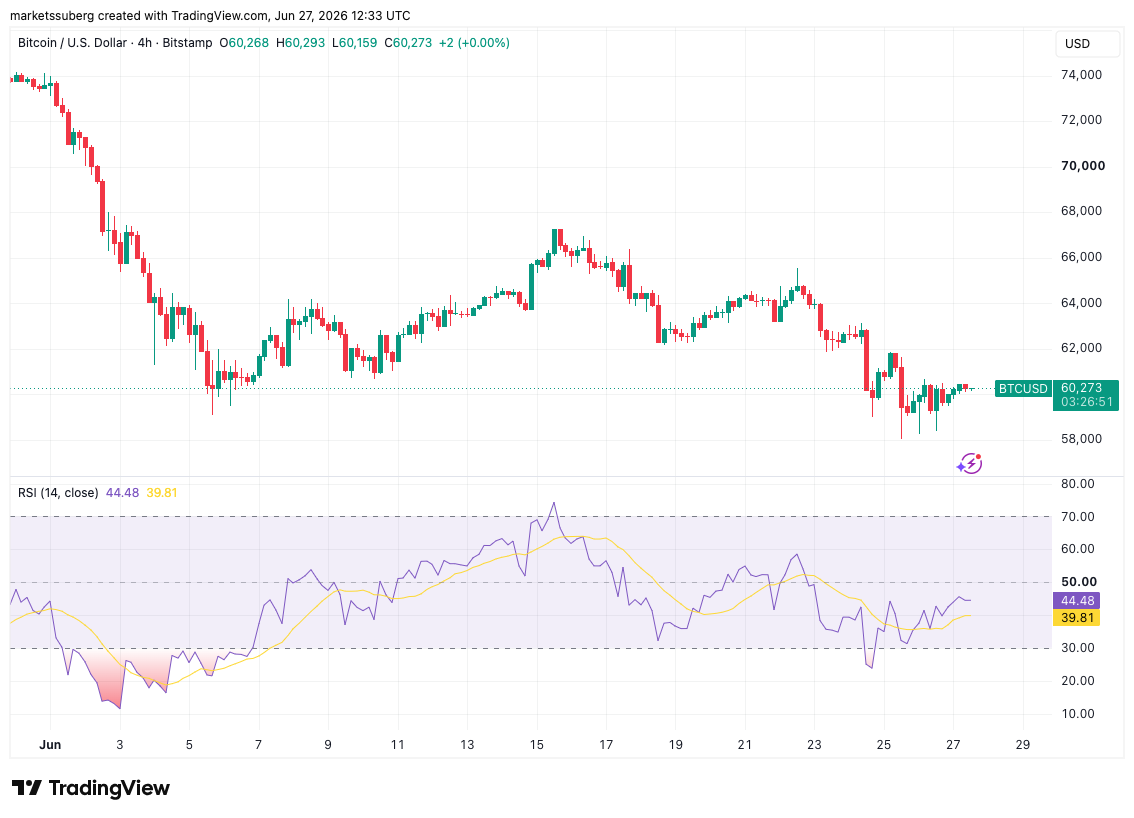
    BTC/USD four-hour chart with RSI data. Source: Cointelegraph/TradingView

    On Friday, crypto analyst Lukasz Wydra added daily time frames to the mix of RSI bull signals.

    “The bullish RSI divergence on the Bitcoin chart has now been officially confirmed. It may still deepen, but at the same time we can clearly see that Binance continues to defend the price,” he told X followers.

    Wydra described the RSI signals as an “encouraging sign.”
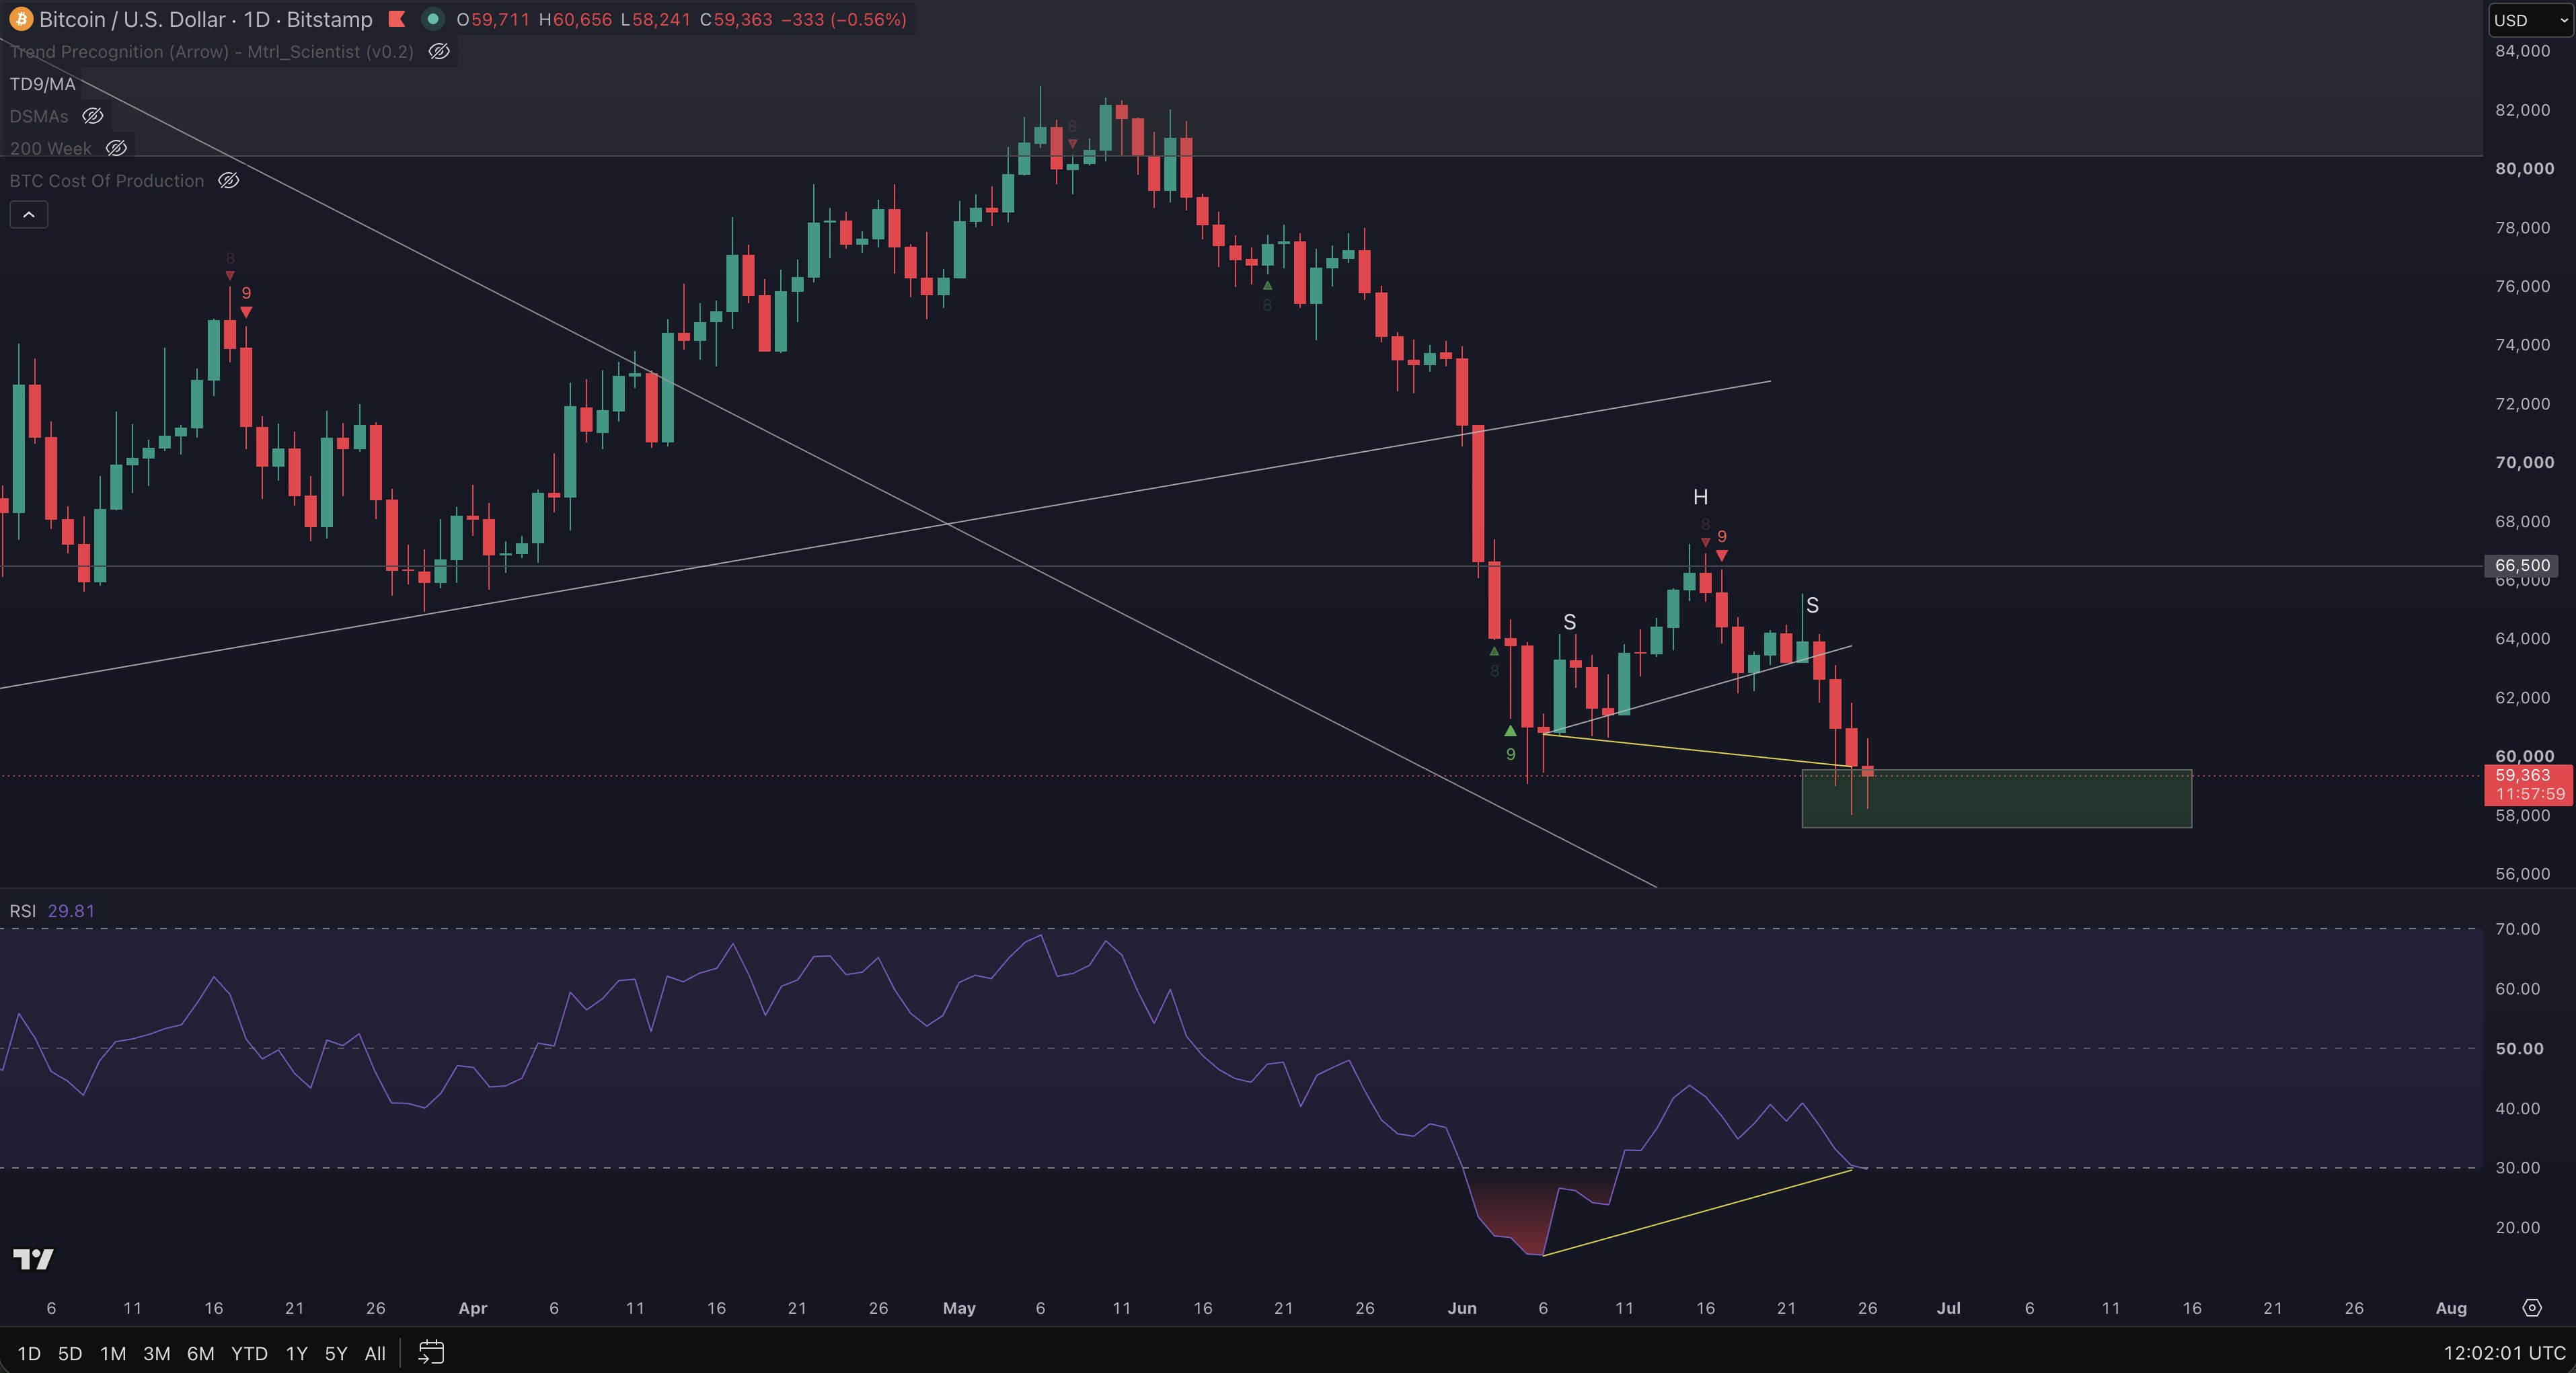
    BTC/USD one-day chart. Source: Lukasz Wydra/X

    New BTC price lows remain popular target

    Other traders stuck to existing predictions of further downside pressure entering sooner or later.

    Related: BTC price four-year trend calls for $76K as analysis says Bitcoin ‘not broken’

    Niels Klaver, cofounder of crypto platform STABL Agency, repeated calls for a trip to $55,000 “before any big move” to change the status quo.
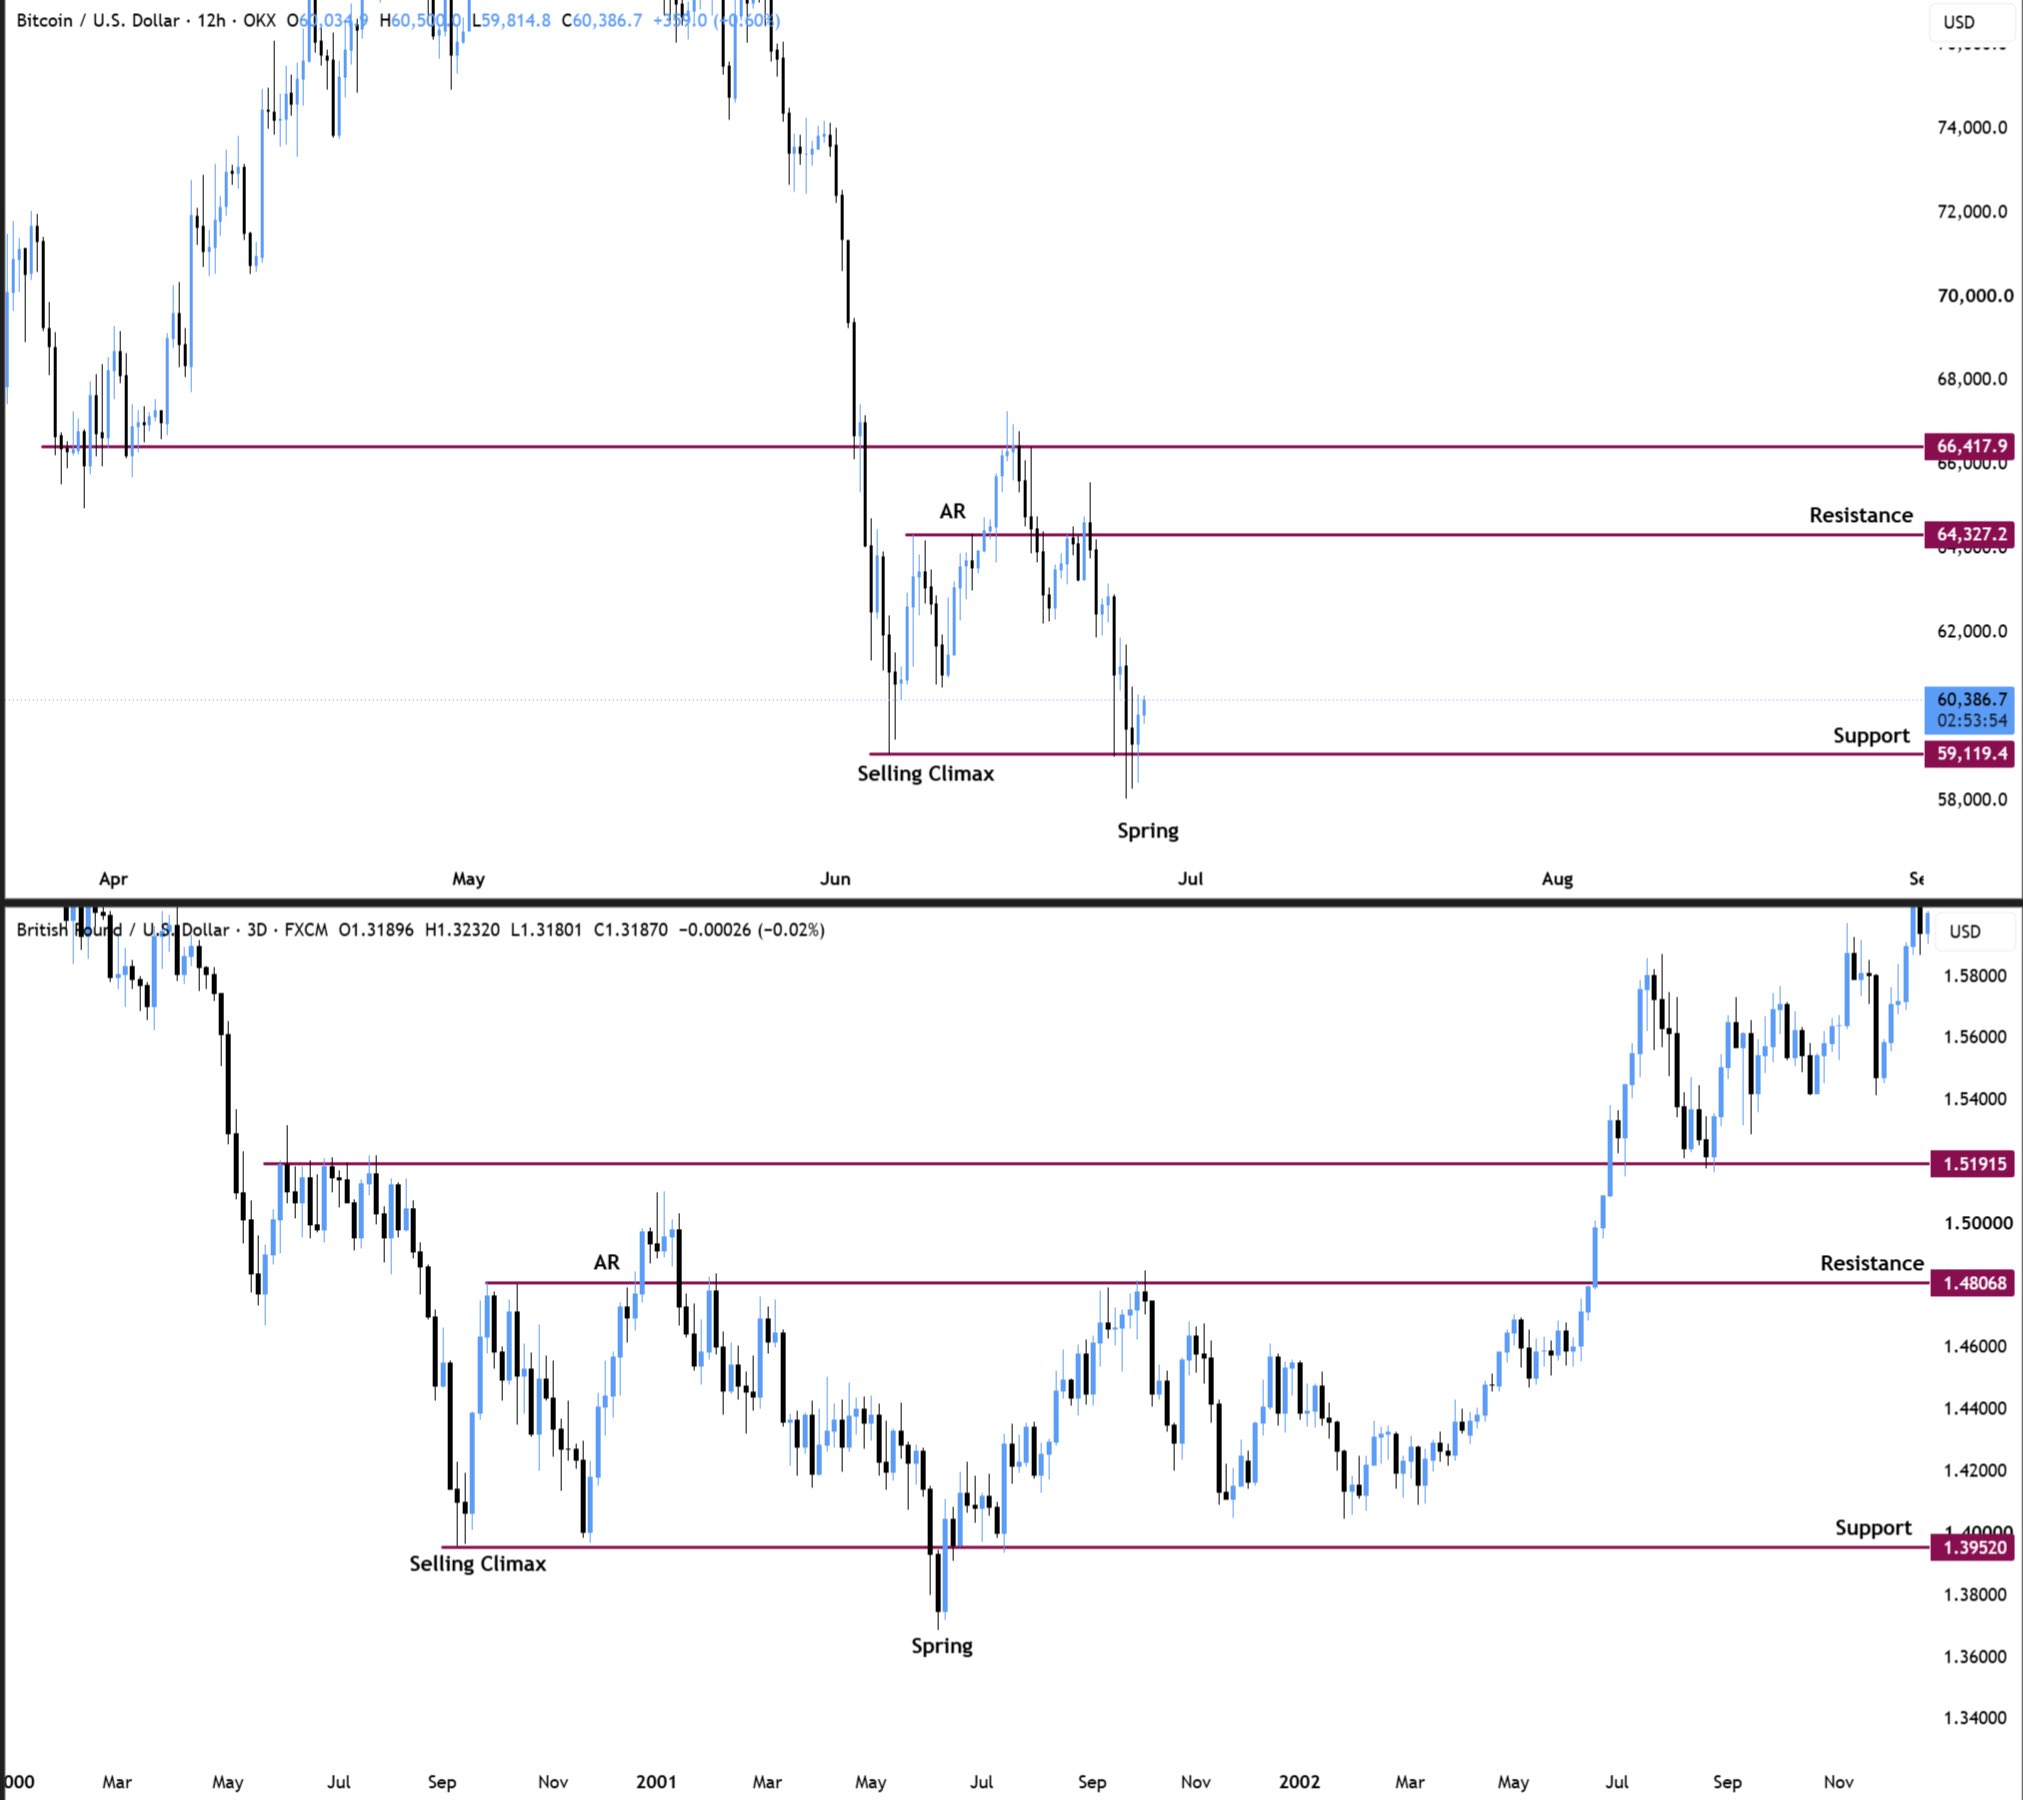
    BTC/USD comparison. Source: Niels Klaver/X

    Trader and analyst Rekt Capital suggested that a relief bounce could characterize the market next month thanks to July typically contrasting with June price action.

    Once it confirmed the 50-month exponential moving average (EMA) as new resistance, BTC/USD would then see “August cancellation of relief and additional downside due to $60k weakening as support,” he wrote this week.
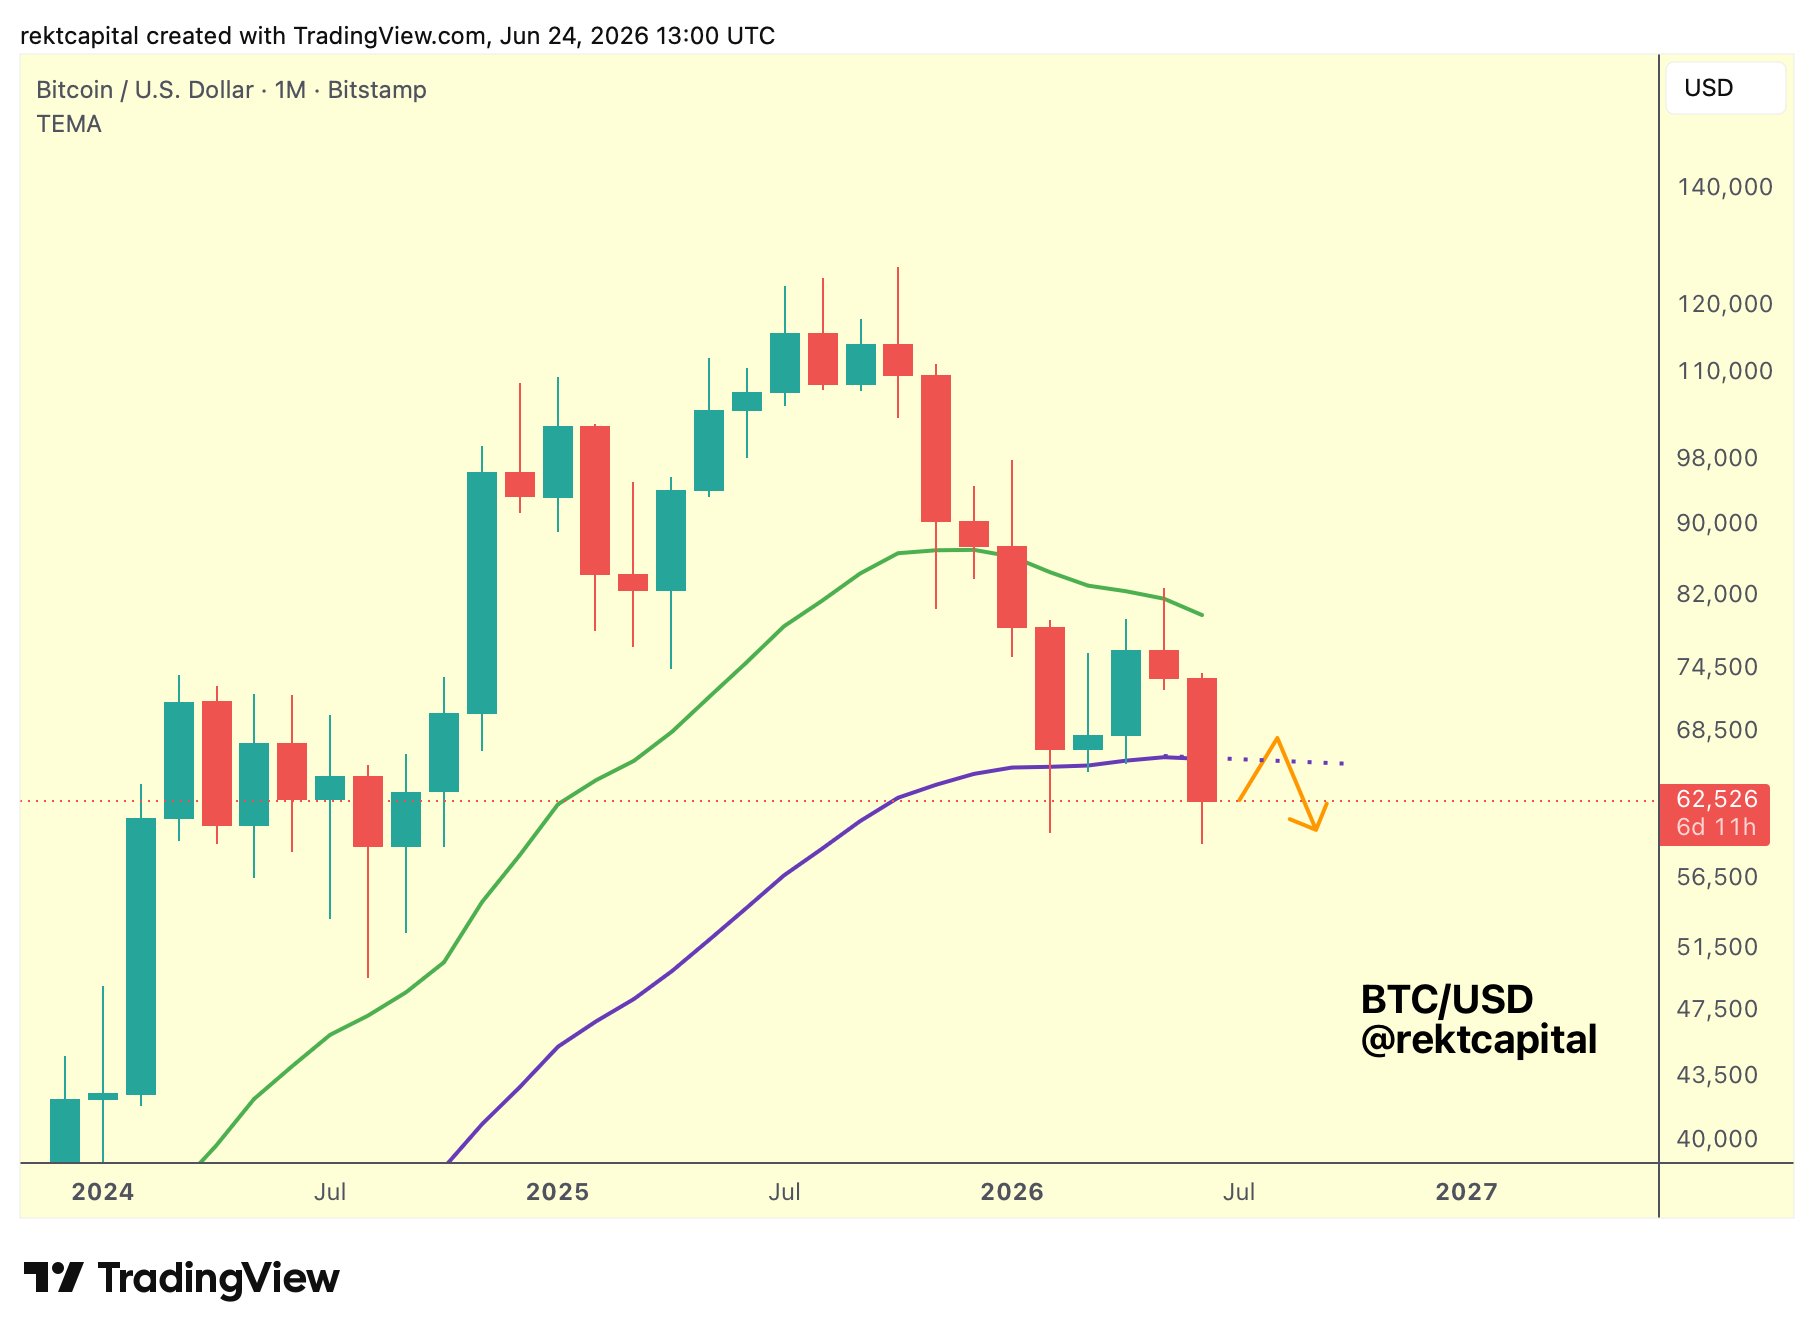
    BTC/USD one-month chart with 21, 50EMA. Source: Rekt Capital/X



    Source link

    Customgpt
    Share. Facebook Twitter Pinterest LinkedIn Tumblr Email

    Related Posts

    Bitcoin Shrugs Off Strategy FUD, Hits New 2-Week Peak in Early Signs of Structural Stabilization

    July 7, 2026

    Bitcoin Bounces Above $63K Following Strategy-fueled Selloff

    July 6, 2026

    Trader Turns $2 Million of ETH Into $14,208 as Lighter Token Rallies 53%

    July 6, 2026

    Can Bitcoin Price Action Avoid Another ‘Absolutely Terrible’ Monday at $63,000?

    July 5, 2026

    Kenyan Treasury Pushes 30% Reserve Requirement as Stablecoin Firms Warn of Higher Costs

    July 5, 2026

    Bitcoin is Close to Sealing a Key “W”-Shaped Reversal Pattern, Notes John Bollinger

    July 4, 2026
    bybit
    Latest Posts

    Moonbeam Pivots From Polkadot to Base to Build AI Agents

    July 7, 2026

    Vitalik Buterin Unveils New ‘Lean Ethereum” Strawmap

    July 7, 2026

    Bitcoin Bounces Above $63K Following Strategy-fueled Selloff

    July 6, 2026

    Trader Turns $2 Million of ETH Into $14,208 as Lighter Token Rallies 53%

    July 6, 2026

    What Does the Average Canadian’s TFSA Look Like at 55?

    July 6, 2026
    quillbot
    LEGAL INFORMATION
    • Privacy Policy
    • Terms Of Service
    • Social Media Disclaimer
    • DMCA Compliance
    • Anti-Spam Policy
    Top Insights

    Bitcoin Shrugs Off Strategy FUD, Hits New 2-Week Peak in Early Signs of Structural Stabilization

    July 7, 2026

    Stock Indexes Settle Higher as Big Tech and Chip Stocks Rally

    July 7, 2026
    Customgpt
    Facebook X (Twitter) Instagram Pinterest
    © 2026 TechoraNewsHub.com - All rights reserved.

    Type above and press Enter to search. Press Esc to cancel.

    bitcoin
    Bitcoin (BTC) $ 63,454.00
    ethereum
    Ethereum (ETH) $ 1,781.07
    tether
    Tether (USDT) $ 0.999095
    bnb
    BNB (BNB) $ 579.90
    usd-coin
    USDC (USDC) $ 0.999921
    xrp
    XRP (XRP) $ 1.13
    solana
    Solana (SOL) $ 81.48
    tron
    TRON (TRX) $ 0.330789
    figure-heloc
    Figure Heloc (FIGR_HELOC) $ 1.04
    staked-ether
    Lido Staked Ether (STETH) $ 2,265.05