



Bitcoin price has come under renewed pressure following its latest market decline, but one prominent analyst believes historical data offers a reason for cautious optimism. Galaxy’s head of firmwide research, Alex Thorn, has identified a technical pattern that previously appeared during two major Bitcoin market recoveries, suggesting the cryptocurrency could avoid establishing fresh bear-market lows.
In a November 9 post on X, Thorn highlighted Bitcoin’s recent move below its 50-week moving average. The cryptocurrency had remained above this important technical indicator for seven consecutive weeks before losing the level again.

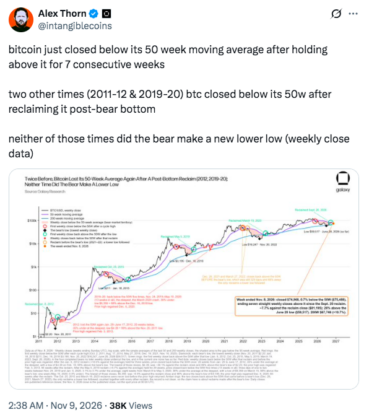
However, the analyst pointed out that similar developments occurred during the 2011–2012 and 2019–2020 market cycles. In both cases, Bitcoin avoided establishing a new bear-market low on a weekly closing basis.
For investors concerned about Bitcoin’s recent weakness, the comparison raises an important question: Could the latest decline represent another temporary setback before a broader recovery?
Bitcoin’s Historical Pattern Offers A Reason For Optimism
According to Thorn, Bitcoin’s latest weekly close below its 50-week moving average resembles patterns observed during previous market recoveries.
The 50-week moving average is widely followed by traders because it helps identify Bitcoin’s longer-term market direction. A sustained move above the indicator can suggest improving momentum, while a breakdown may signal renewed selling pressure.
Nevertheless, Thorn’s analysis suggests that losing this level does not necessarily mean Bitcoin is heading toward another major market bottom.
Alex Thorn’s original X post — November 9, 2026
bitcoin just closed below its 50 week moving average after holding above it for 7 consecutive weeks
two other times (2011-12 & 2019-20) btc closed below its 50w after reclaiming it post-bear bottom
neither of those times did the bear make a new lower low (weekly close data)
— Alex Thorn (@intangiblecoins)
The historical comparison is particularly interesting because Bitcoin has experienced significant volatility in recent weeks, leaving investors uncertain about the strength of its recovery.
As we have seen in previous Bitcoin price analysis, important technical levels can influence market sentiment and determine whether buyers regain control.
Still, Thorn emphasized that historical comparisons have limitations. Only five recoveries above the 50-week moving average form the available sample, making it difficult to predict future price movements with certainty.
The analyst also acknowledged that identifying a definitive market bottom is only possible with hindsight.
Can Bitcoin Reclaim The 50-Week Moving Average?
While the historical pattern offers some encouragement, Thorn believes the next several weeks could be particularly important for Bitcoin.
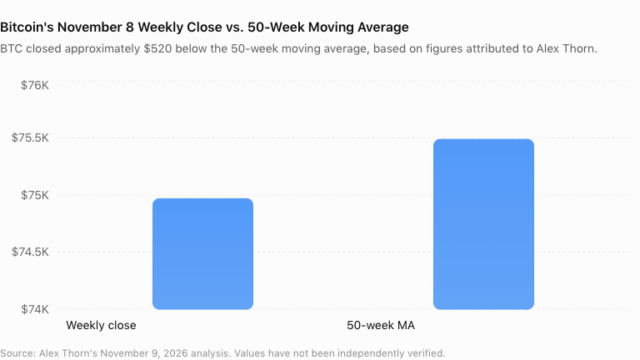
Bitcoin’s weekly closing price falls below its 50-week moving average. Source: Alex Thorn.
In a follow-up post, the analyst explained that his bullish technical outlook would remain valid if Bitcoin reclaimed its 50-week moving average within approximately one month.
This gives the cryptocurrency a relatively short window to demonstrate renewed buying strength.
Bitcoin’s November 8 weekly close stood near $74,968, below its 50-week moving average of approximately $75,488. Meanwhile, the June 2026 weekly closing low near $59,517 remains an important reference point for the historical comparison.
A sustained recovery above the moving average could strengthen the bullish outlook, particularly as traders continue monitoring key resistance levels and the possibility of a broader Bitcoin recovery.
Thorn’s optimism also extends beyond technical indicators. In an earlier report, he outlined a bullish investment thesis based on Bitcoin’s fundamentals, market positioning, sentiment, and long-term potential.
These factors could become increasingly important as investors evaluate whether the cryptocurrency is approaching another accumulation opportunity.
However, Bitcoin still needs to demonstrate that buyers can defend important support levels and regain momentum.
For now, the 50-week moving average remains a key technical level to watch. If Bitcoin successfully reclaims it in the coming weeks, Thorn’s historical comparison could provide additional support for a longer-term bullish outlook.
Although the market remains uncertain, the analyst’s findings suggest that Bitcoin’s latest breakdown does not necessarily mean its broader recovery has come to an end.

Editorial Process for bitcoinist is centered on delivering thoroughly researched, accurate, and unbiased content. We uphold strict sourcing standards, and each page undergoes diligent review by our team of top technology experts and seasoned editors. This process ensures the integrity, relevance, and value of our content for our readers.


