



Ether (ETH) has rebounded more than 25% from its February low below $1,800, and a mix of technical and onchain signals suggests the recovery may still have more room to run in May.
Key takeaways:
- Ether’s technicals favor the bulls with a $3,000 ETH price target.
- ETH is holding a support zone that has previously triggered 22%–27% price rebounds.
- Ether’s spot taker CVD remains positive, suggesting confidence among buyers.
ETH price charts target $3,000
Ether’s technical setups on multiple time frames support the bull case for ETH price as April comes to a close.
The ETH/USD pair has been forming a bull flag chart pattern on the daily chart since early April, as shown below.

Related: Ethereum to $60K? It’s a ‘generational play’ for ETH bull Tom Lee, says analyst
A bull flag pattern is a bullish continuation pattern that forms after the price consolidates inside a down-sloping range following a sharp price rise.
The flag will resolve once the price breaks above the upper trend line at $2,350 and could rise by as much as the previous uptrend’s height. This places the upper target for ETH price just above $3,000, about 33.5% above the current price.
ETH/USD daily chart. Source: Cointelegraph/TradingView
Meanwhile, an ascending triangle on the eight-hour chart suggests that ETH was preparing for a significant upward move.
A break above the upper trend line of the triangle at $2,400 would validate the pattern, opening the way for a rally toward the measured target of the triangle at $3,305. Such a move would bring the total gains to 46%.
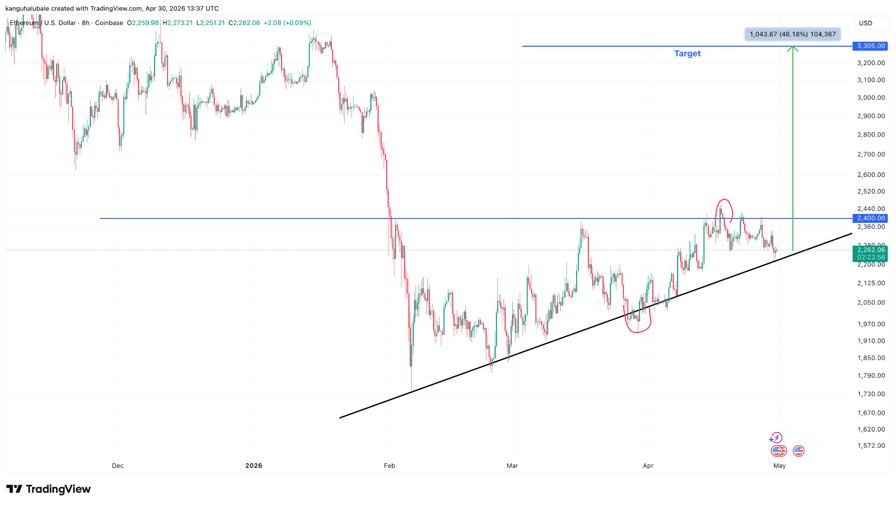
ETH/USD daily chart. Source: Cointelegraph/TradingView
Other technical setups suggest ETH’s price could climb toward $3,000-$6,000 in the coming months.
ETH price sits on strong support around $2,000
Since early February, ETH/USD has been forming higher lows, with the price consistently respecting a multi-month support trend line.
Each rebound from this trend line has preceded 22%–27% price rallies, often driving ETH back toward or even beyond the high formed after the last rebound. The current setup mirrors those prior cycles.
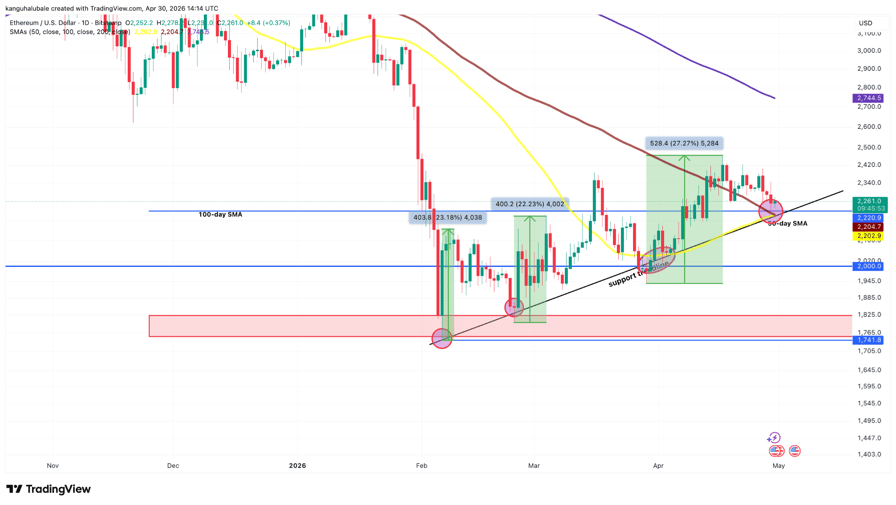
ETH/USD daily chart. Source: Cointelegraph/TradingView
Ether is now consolidating near the trend line support around $2,000-$2,200, which also coincides with the 50-day (yellow wave) and 100-day SMAs (brown), a key dynamic support level in ongoing uptrends.
Meanwhile, UTXO realized price distribution (URPD) data shows that Ether is sitting on a significant support zone between $1,980 and $2,178, where investors acquired 7.4 million ETH.
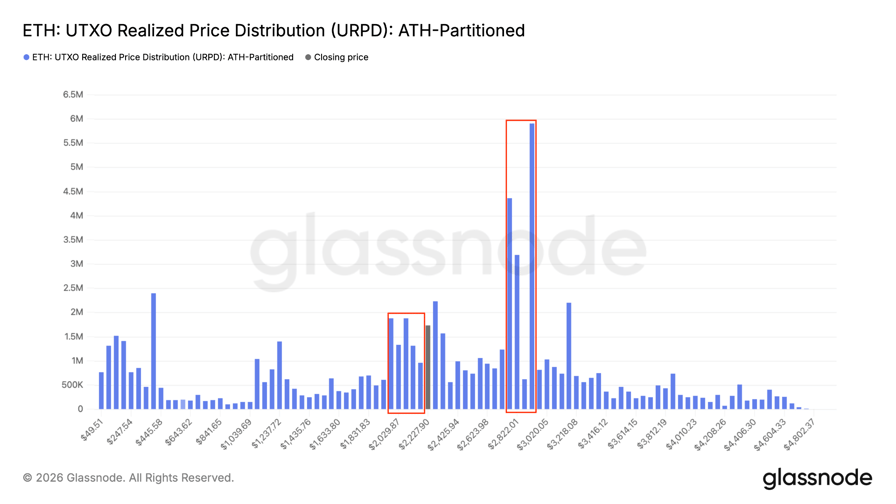
ETH URPD all-time high partitioned. Source: Glassnode
A rebound from this range increased the odds of Ether’s price rising higher to beat resistance at $2,400, toward the next major resistance at $2,800-$3,000, where investors acquired approximately 14 million ETH.
Ether’s spot taker CVD signals high buyer volumes
Ether’s 90-day spot taker cumulative volume delta (CVD) shows that buy-orders (taker buy) have become dominant again. CVD measures the difference between buy and sell volume over three months.
The metric remained in the neutral zone between mid-February and mid-March, as ETH/USD consolidated within the $1,800-$2,200 range.
The CVD flipped positive (green bars in the chart below) on March 15 as the price broke above the $2,200 resistance and has remained positive since. This indicates optimism among traders, as they’re actively positioning for further gains.
If the CVD remains green, it means buyers are not backing down, which could set the stage for another wave of upward movement, as seen in historical rallies. A similar occurrence in 2024 accompanied an 85% price rally.
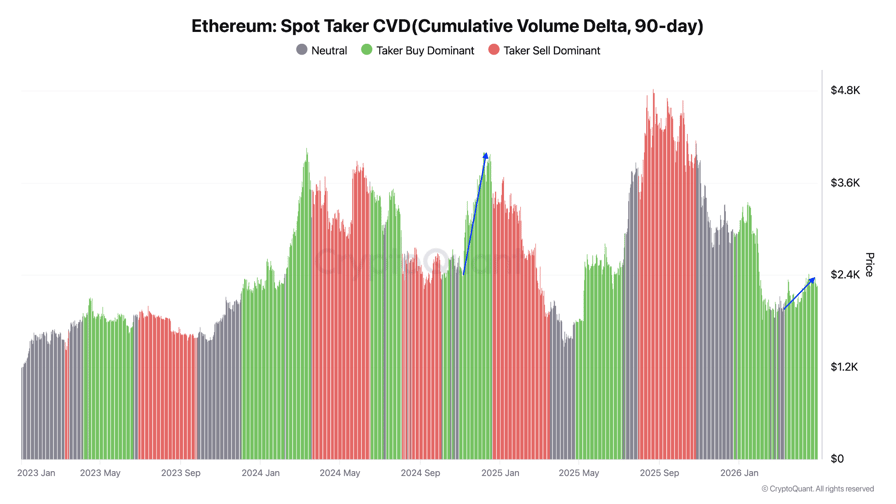
ETH spot taker CVD. Source: CryptoQuant
Meanwhile, Ether’s taker buy volume jumped to over $1 billion on Wednesday, suggesting bulls took advantage of the drop below $2,300 to buy more, data from CryptoQuant shows.
“The move below the $2,300 zone today nonetheless reignited interest among traders,” CryptoQuant analyst Darkfost said in a QuickTake note on Thursday, adding:
“This suggests that market participants still appear willing to bet on a more constructive short term outlook for Ethereum.”
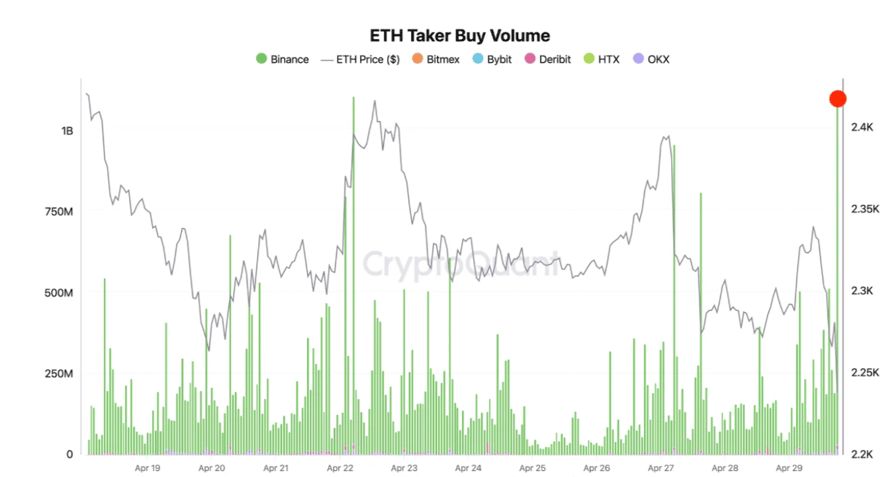
ETH taker buy volume. Source: CryptoQuant