


Every major economy is staring at the same problem right now. Artificial intelligence is consuming electricity at a pace that grids were never designed to handle. In the US, capacity market prices in PJM, the country’s largest grid operator, have risen more than tenfold in two years, with data-centre growth identified as a primary driver. In Europe, utilities are scrambling to upgrade transmission infrastructure fast enough to keep pace with hyperscalers’ demand.
The International Energy Agency (IEA) projects global data-centre electricity consumption could approach 1,000 TWh by the end of this decade. Renewable energy is largely there, but the ability to coordinate it, through AI energy grid mapping at national scales, is what most countries still lack. But China just built it.
A study published in Nature this week by researchers from Peking University and Alibaba Group’s DAMO Academy has produced something that no country has managed before: a complete, high-resolution, AI-generated inventory of an entire nation’s wind and solar infrastructure, with the analytical framework to coordinate it as a unified system.
Using a deep-learning model trained on sub-metre satellite imagery, the team identified China’s 319,972 solar photovoltaic facilities and 91,609 wind turbines, processing 7.56 terabytes of imagery to do so.

AI energy grid mapping
Prior research into solar-wind complementarity – the idea that two sources can offset each other’s variability in time and geography – has largely relied on hypothetical or modelled deployment scenarios. How complementarity manifests under real-world infrastructure, and how it shapes system-level integration outcomes, has until now remained unclear.
The researchers show that solar-wind complementarity substantially reduces generation variability, with effectiveness increasing as the geographic scope of pairing expands.
In practical terms, the further apart the facilities being coordinated are, the more reliably they achieve balance. A cloud that covers solar farms in Gansu does not darken wind corridors in Inner Mongolia, for example. The study’s findings point to a structural inefficiency in how China currently manages its grid: coordination happens at a provincial rather than national level.
Transitioning to a unified national scale, the researchers argue, would make it easier to pair complementary energy sources, stabilise the grid, and avoid curtailment – the wasting of generated renewable power that has long been one of China’s most costly clean-energy problems.
Liu Yu, a professor at Peking University’s School of Earth and Space Sciences, described the inventory as allowing China to see its new-energy landscape from a “God’s-eye view,” a phrase that carries more operational weight than it might first suggest. Grid operators cannot optimise what they are not aware of – until now.
China is in the middle of an AI-driven electricity demand surge that is straining its grid. The rapid proliferation of data services and massive computing facilities have pushed the sector’s power consumption up 44% year-on-year in the first quarter of 2026, reaching 22.9 billion kilowatt-hours, according to the China Electricity Council.
That is an extraordinary rate of growth for a sector whose demand was already great. This has accelerated data-centre expansion in China’s northern and western provinces, where land is cheaper, wind and solar resources are more available, with commensurately lower electricity prices. The provinces being targeted for new data centres are the same regions with the highest solar-wind complementarity.
Behind the model
The technical achievement behind this is worth understanding in its own right. DAMO’s deep-learning model was trained to identify solar photovoltaic facilities and wind turbines from sub-metre resolution satellite imagery, a task complicated by the sheer diversity of installation types, terrain conditions, and image quality.
The resulting dataset covers installations in 1,915 Chinese counties, spanning everything from rooftop panels in coastal cities to utility-scale wind farms on the Mongolian plateau. Processing 7.56 terabytes of imagery to produce a nationally consistent, county-level inventory is a demonstration of what large-scale geospatial AI can do when applied to infrastructure problems, and a template that other countries could, in principle, replicate.
China’s clean energy sector generated an estimated 15.4 trillion yuan (US$2.26 trillion) in economic output last year, equivalent to Brazil’s entire GDP, according to the Finland-based Centre for Research on Energy and Clean Air. Managing an asset base of that scale without a national-level visibility tool was always going to be a limiting factor, a limit that’s now gone.
The study’s dataset and code have been made publicly available via Zenodo.
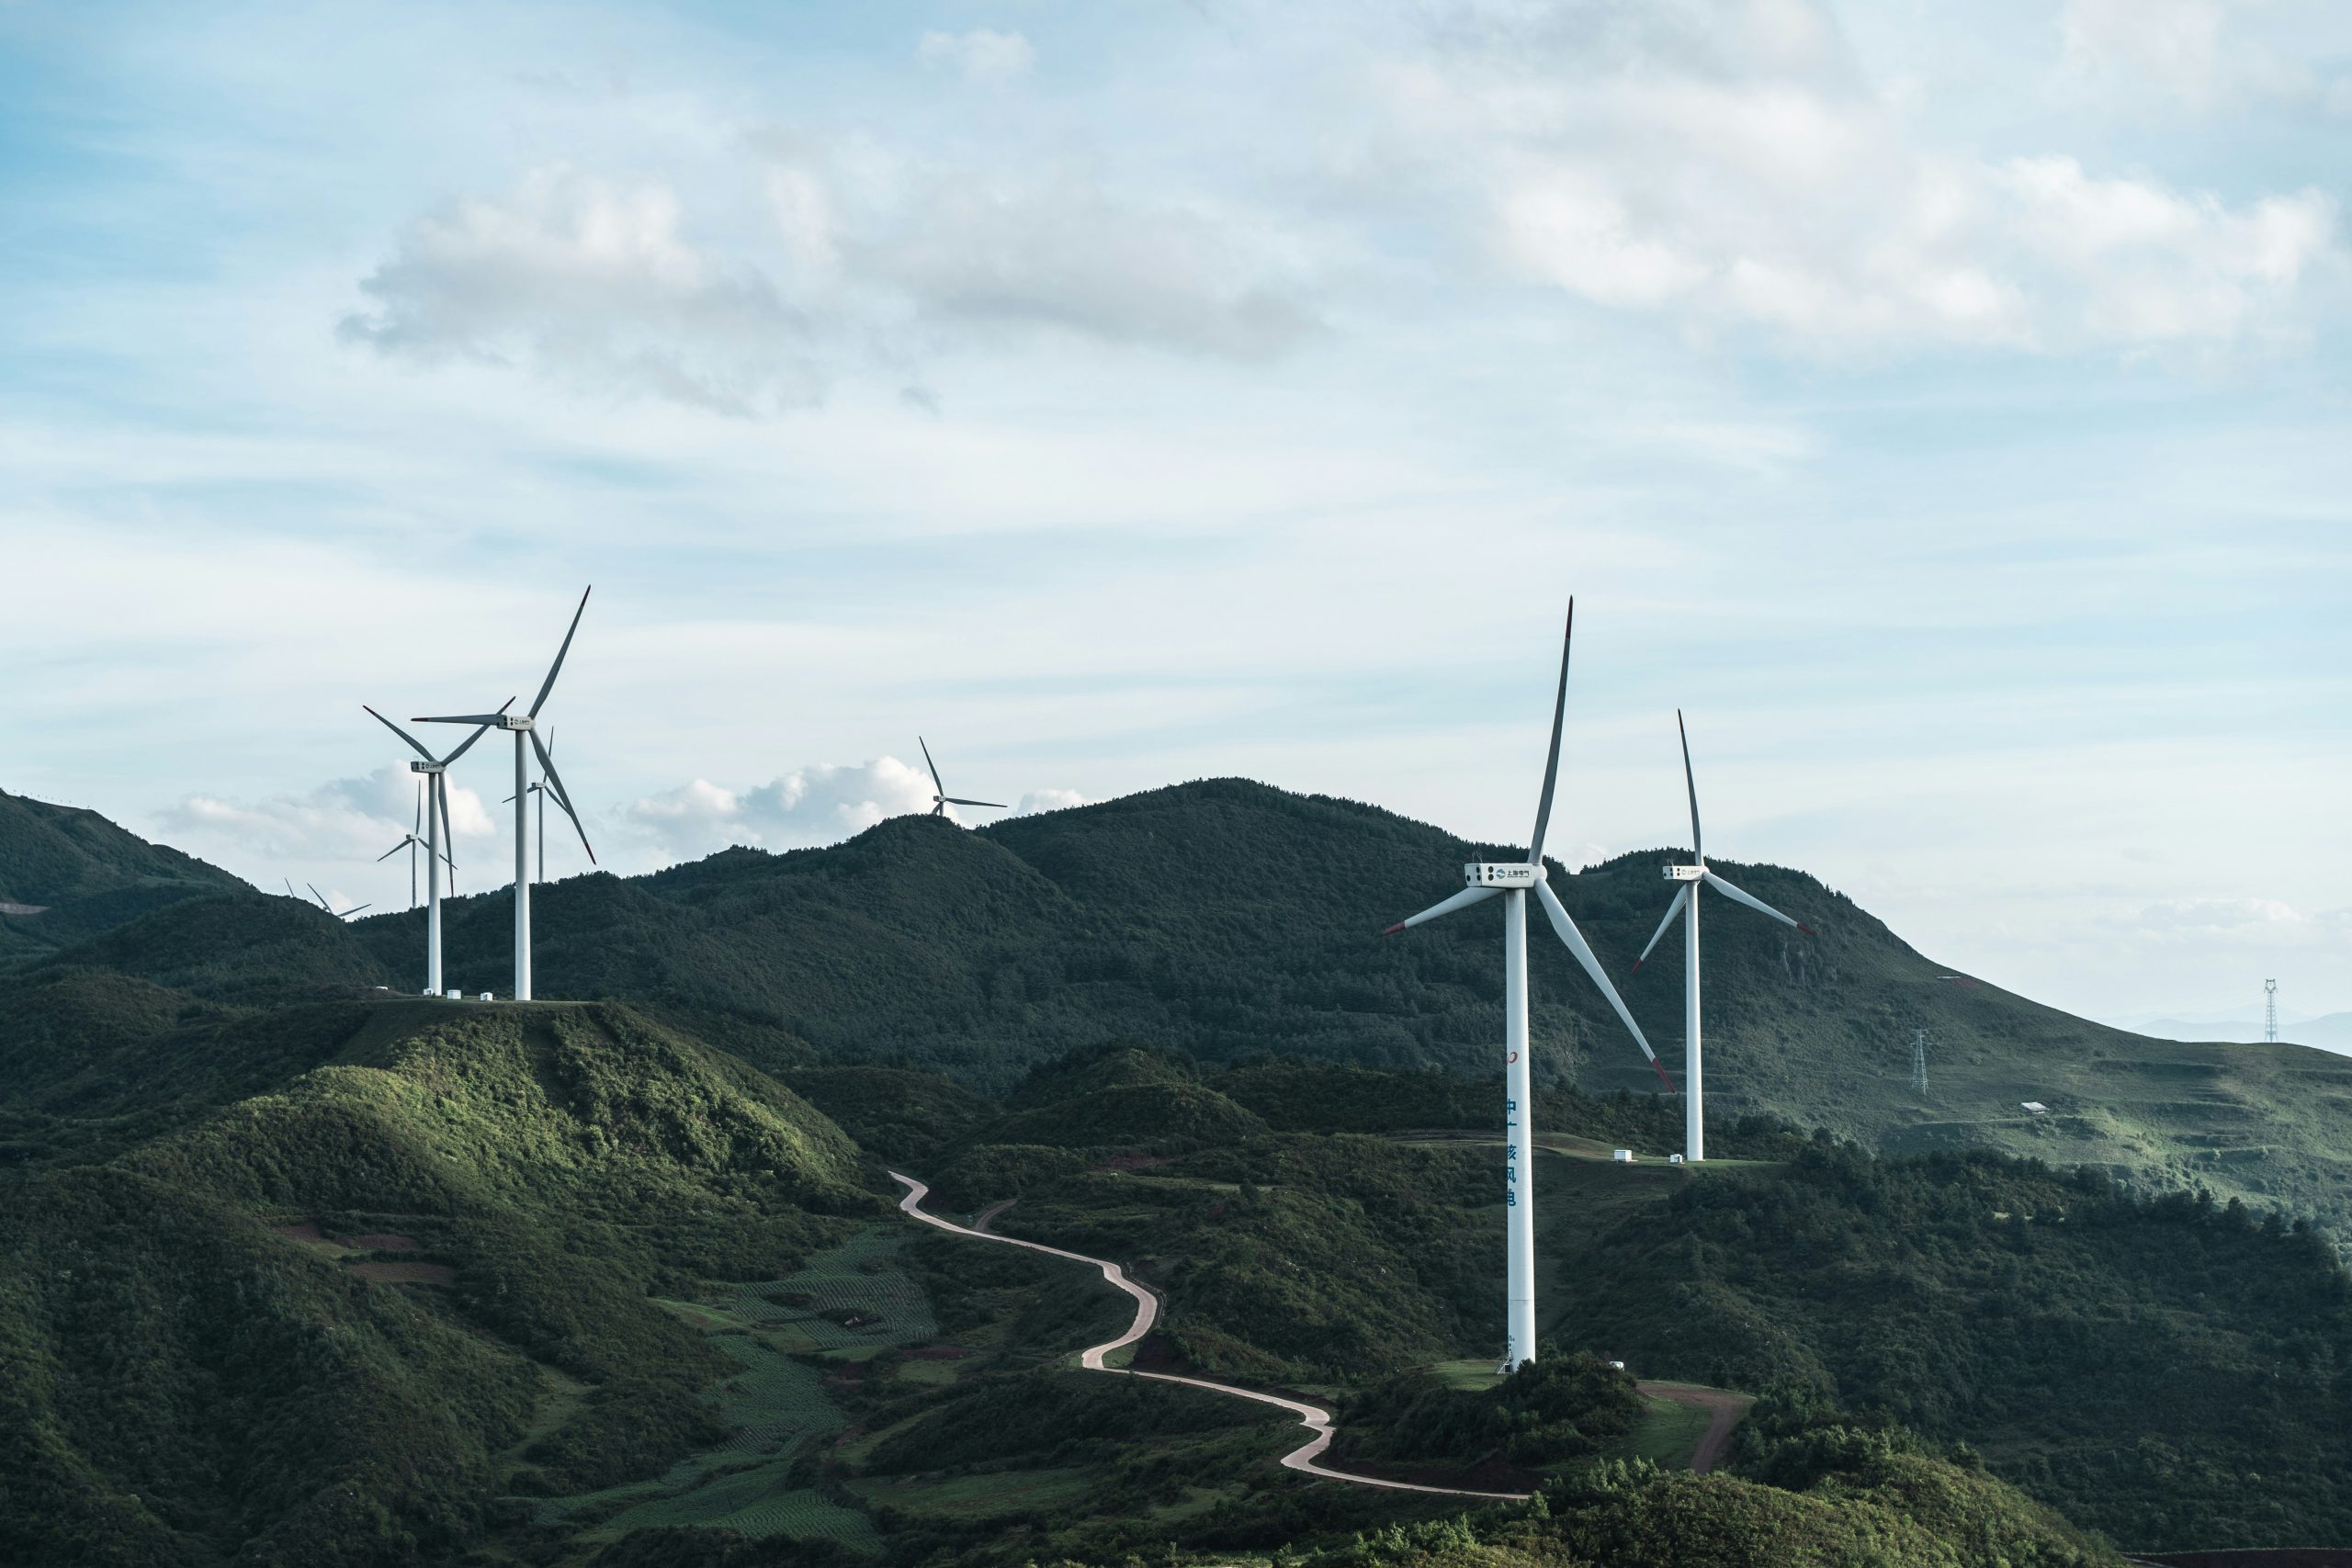
(Photo by Luo Lei)
See also: Inside China’s push to apply AI in its energy system
Want to learn more about AI and big data from industry leaders? Check out AI & Big Data Expo taking place in Amsterdam, California, and London. The comprehensive event is part of TechEx and is co-located with other leading technology events, click here for more information.
AI News is powered by TechForge Media. Explore other upcoming enterprise technology events and webinars here.