



Bitcoin (BTC) fell below $65,000 on Thursday as US stocks slid amid another round of escalation in Iran.
Key points:
- Several days of US-Iran escalation are beginning to take their toll on crypto and stock market performance.
- Bitcoin sees three-day lows under $65,000 as traders diverge on the near-term outlook.
- A 21-day moving average trend line becomes important nearby support.
Bitcoin wobbles as Iran destabilizes stocks, oil and US bond yields
Data from TradingView showed BTC/USD hitting three-day lows of $64,799 on Bitstamp.
BTC/USD one-hour chart. Source: Cointelegraph/TradingView

Risk assets felt the strain on the day as US President Donald Trump warned that he would blame Iran for recent Houthi strikes on Saudi Arabian commercial vessels.
In a post on Truth Social, Trump said that he was “very disappointed” in the Houthis, referencing attacks on US ships from 2025.

Source: Donald Trump on Truthsocial.com
By the close of New York trading, the S&P 500 had fallen 1.2% and the Nasdaq had shed 2.2%, while oil prices rallied to their highest since early June, with Brent crude topping $100 a barrel.
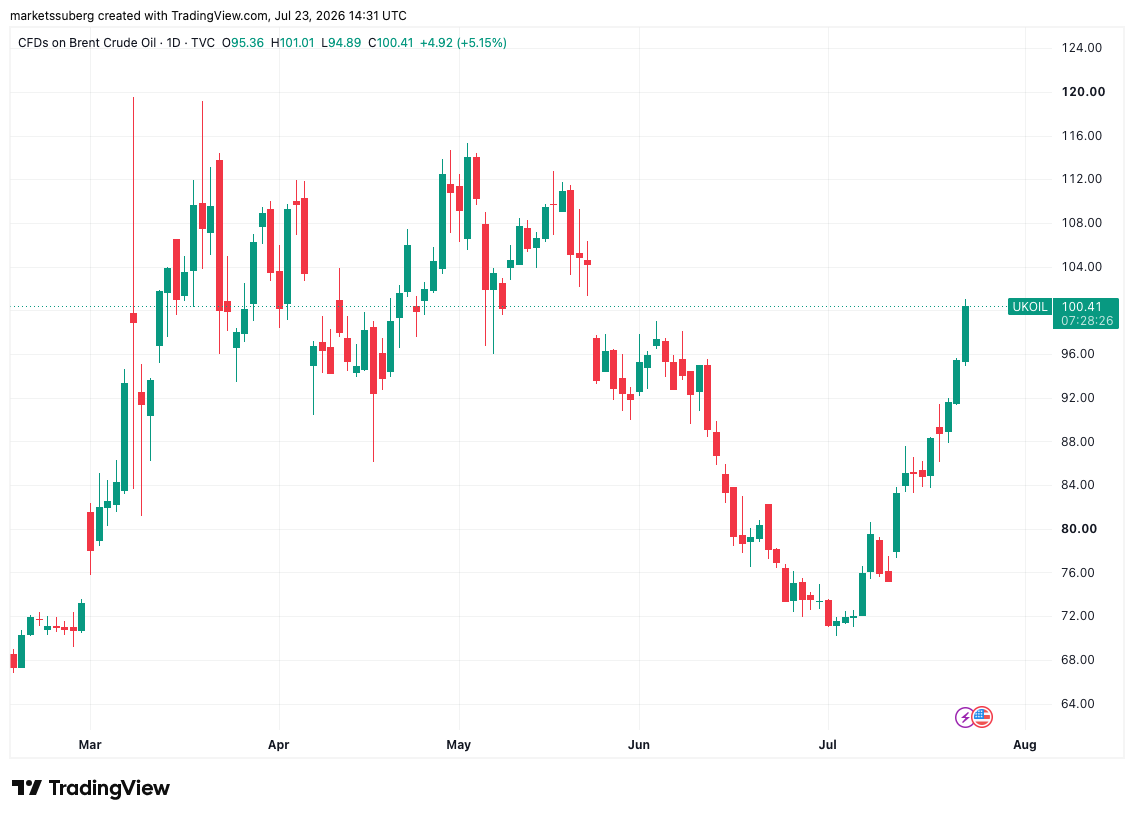
CFDs on Brent crude oil one-day chart. Source: Cointelegraph/TradingView
“Inflation expectations and interest rates are rising sharply again,” trading resource The Kobeissi Letter wrote in a response on X.
Ahead of the Federal Reserve’s next interest-rate decision, data from CME Group’s FedWatch Tool showed an increasing chance of officials hiking by 0.25% — traditionally a headwind for crypto markets. Odds neared 40% on Thursday, while a week prior, they were closer to 12%.
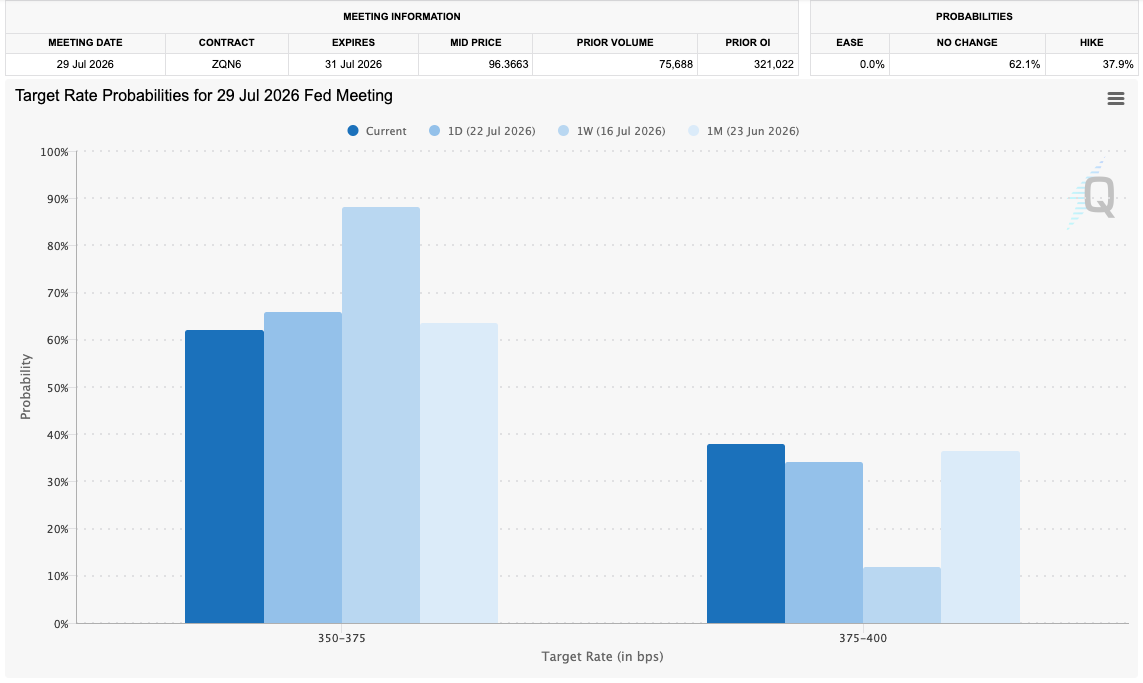
Fed target-rate probability comparison for July FOMC meeting. Source: CME Group
Kobeissi, meanwhile, noted 18-month highs in US 10-year bond yields in a sign of fresh economic strain.
Related: Bitcoin will get ‘lift’ from Hyperliquid, Robinhood in next crypto bull market: Bitwise exec
BTC price analysis offers hope of $73,000
Bitcoin traders showed an increasing split over what short-term BTC price action would bring.
Commentator Exitpump argued that the Bitcoin relief rally is likely to end by late July, reinforcing an established theory that has already gained traction.
“July rally is coming to end, price is at resistance, close your longs, go short once price breaks below 65K,” they told X followers late on Wednesday.
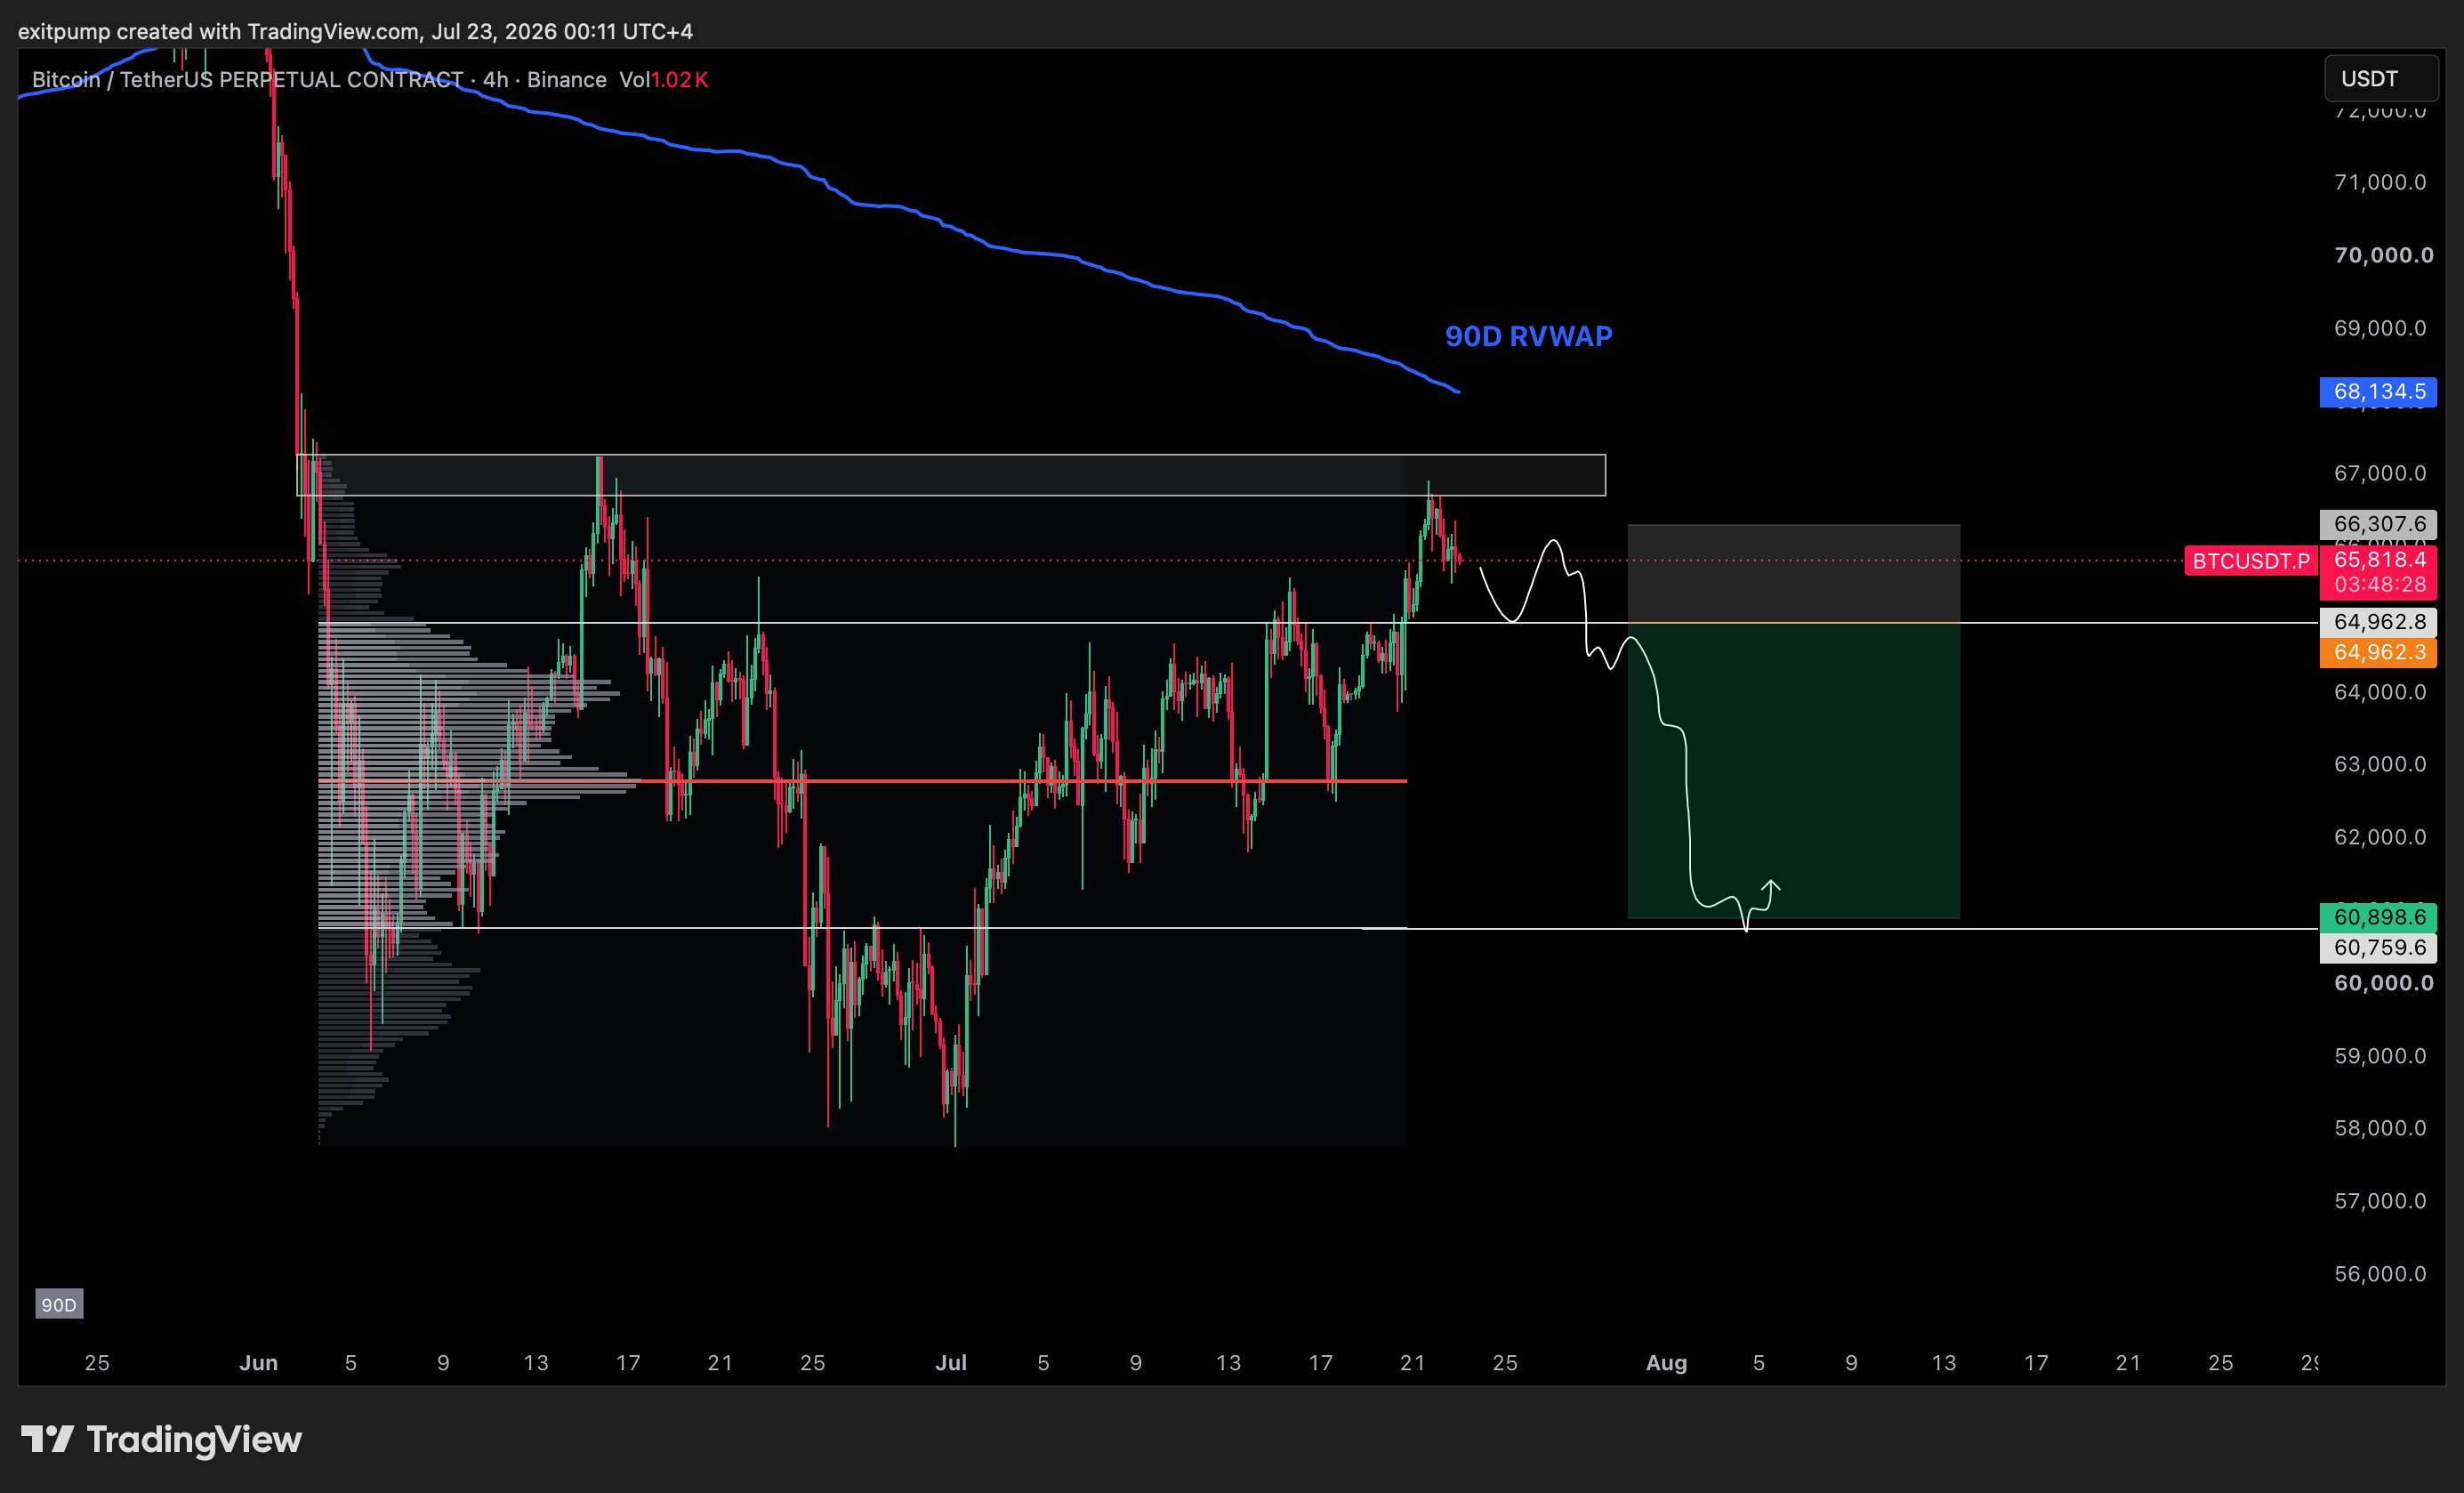
BTC/USDT perpetual contract four-hour chart. Source: Exitpump on X.com
Others were more hopeful, with trader Jelle arguing that price was “still making progress.”
“Clear this local area and that void towards $70k opens up – could be a quick move to form the new range. Patience remains my game,” he reported.
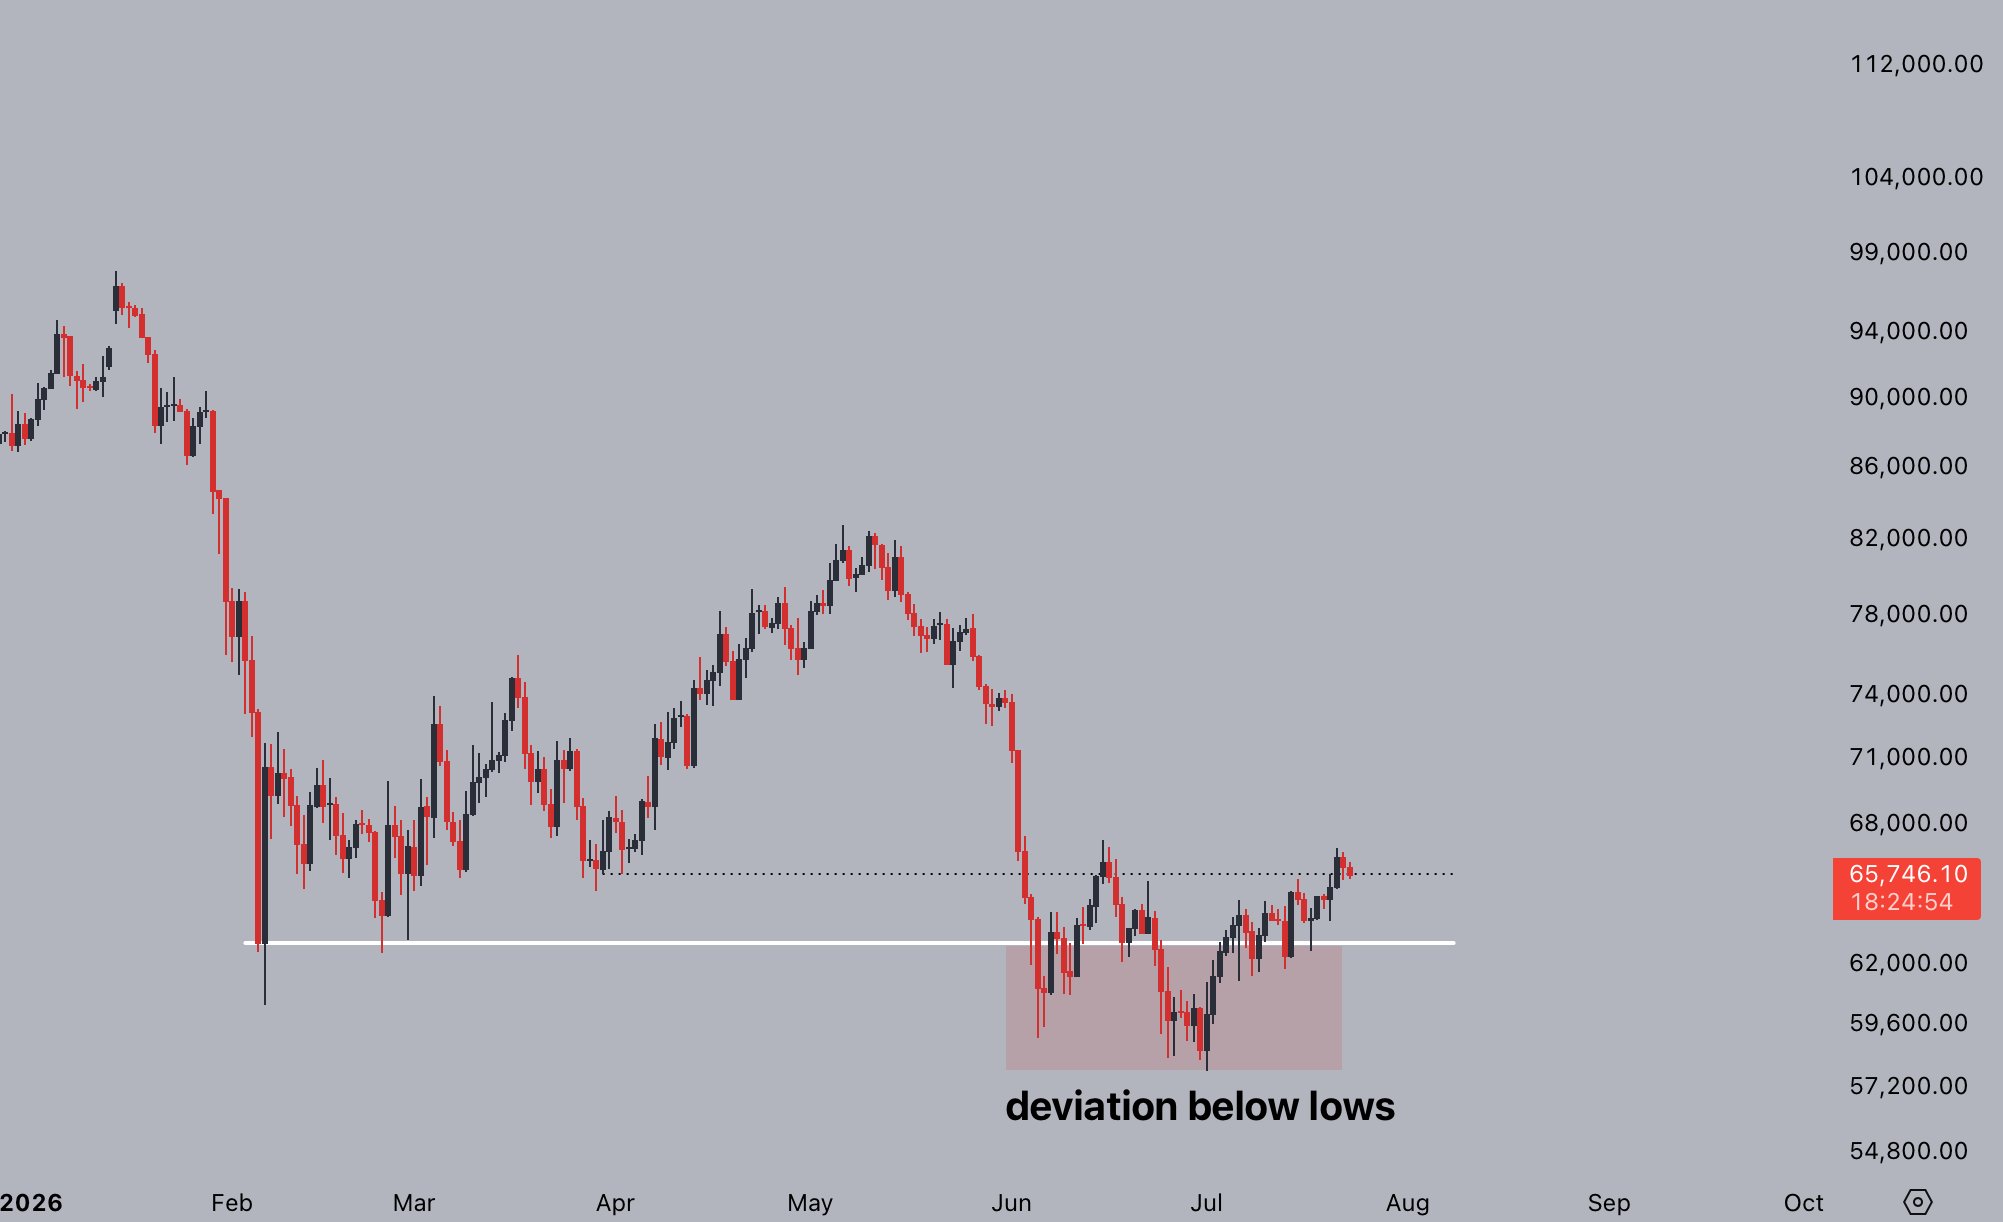
BTC/USD chart. Source: Jelle on X.com
According to crypto trader and analyst Michaël van de Poppe, the 21-week simple moving average (SMA) at $64,073 was key.
“Theoretically, the target area for Bitcoin is reached. However, as long as this stays above the 21-Day MA, I’m sure there will be a higher valuation for Bitcoin in the near-term,” an X post on the day stated, adding:
“It’s facing the final hurdle for a big breakout, which is the $68,000 resistance zone. It’s been tested once, and this is the second test that we’ll be facing.”
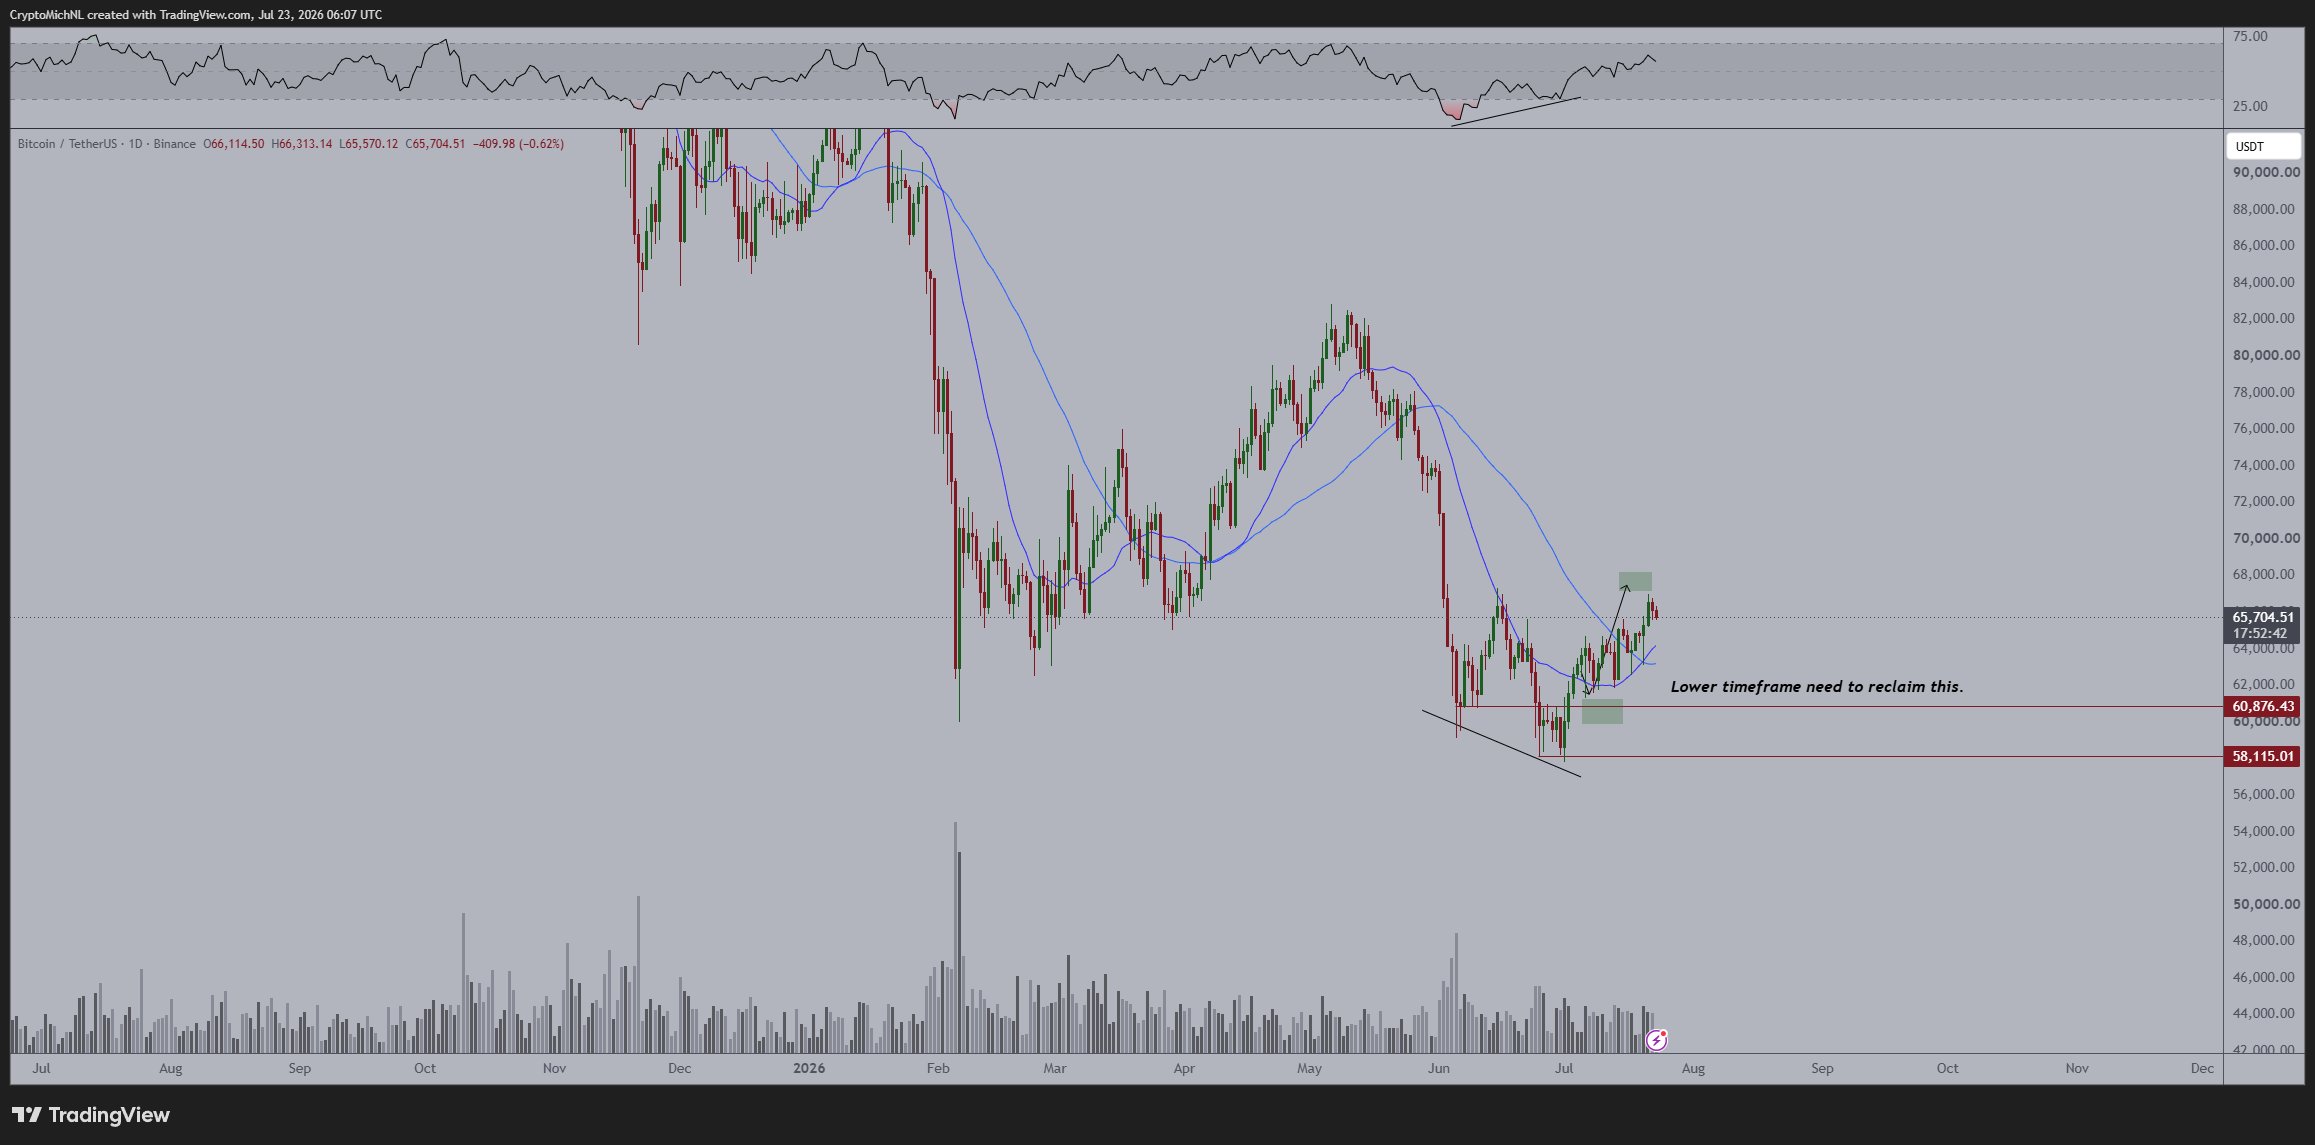
BTC/USDT one-day chart. Source: Michaël van de Poppe on X.com
Van de Poppe gave a $73,000 target should bulls successfully break through resistance.