



Bitcoin (BTC) is up roughly 30% from its Feb. 6 low below $60,000 as a multi-year bullish chart pattern suggests BTC price could rise to as high as $220,000 in the coming months.
Key takeaways:
- Bitcoin’s cup-and-handle pattern puts BTC’s minimum target at $220,000, but $74,000 must hold.
- Bitcoin spot volume has collapsed 81% since October 2025, a precursor to the end of every bear market.
Bitcoin’s cup-and-handle pattern targets $220,000 and above
Bitcoin price has formed a cup-and-handle (C&H) pattern on the weekly chart, suggesting that a massive upward move is still in the cards for BTC.
A cup-and-handle is a bullish continuation pattern where a rounded price recovery forms the “cup,” followed by a short consolidation inside a “handle” before a breakout.
It is resolved after a breakout above the handle’s resistance line, typically signalling a strong upward move, with the price target equal to the cup’s depth added to the breakout level.
“Bitcoin has just completed a multi-year cup-and-handle pattern,” technical analyst Crypto Tice said in a Monday post on X.
The analyst explained that C&H breakouts don’t result in small price movements, adding that “they move hundreds of percent.”
Bitcoin price has retested the cup’s $65,000-$74,000 neckline, which must be held to complete the breakout.
“The retest just finished. The launch is next,” the analyst said, adding:
“$220K is the minimum target.”
BTC/USD weekly chart. Source: X/Crypto Tice
Data from TradingView shows the measured target of the C&H pattern is $295,000, roughly 280% above the current price.
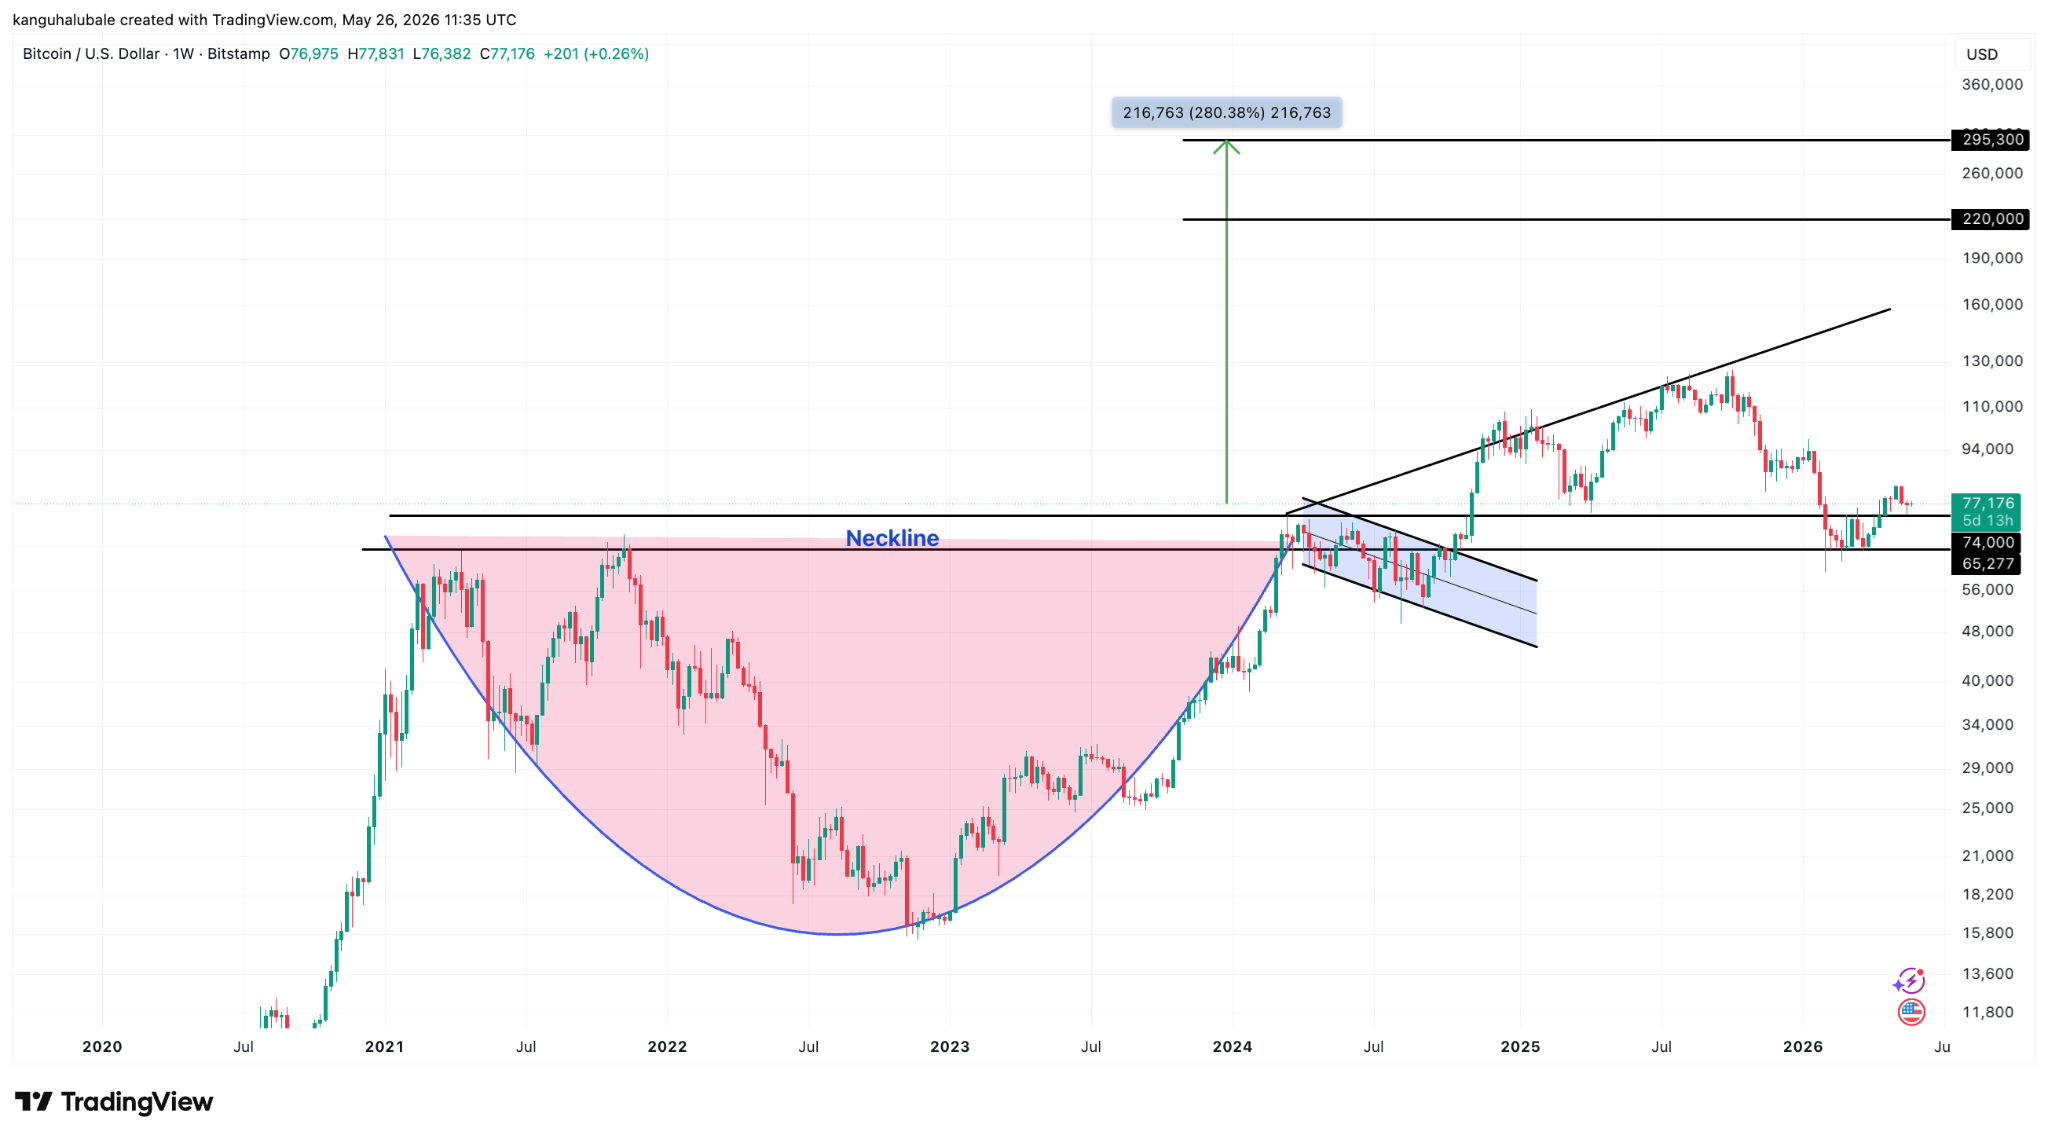
BTC/USD weekly chart. Source: Cointelegraph/TradingView
Earlier, Cointelegraph reported that Bitcoin’s Decay Channel—a logarithmic price model—suggested that BTC could rally as high as $255,000 by year-end, with its 2027 target extending to $308,000.
Trader VeLLa Crypto says the BTC/USD pair “must hold” the $74,000 support area first, to boost its bullish outlook.
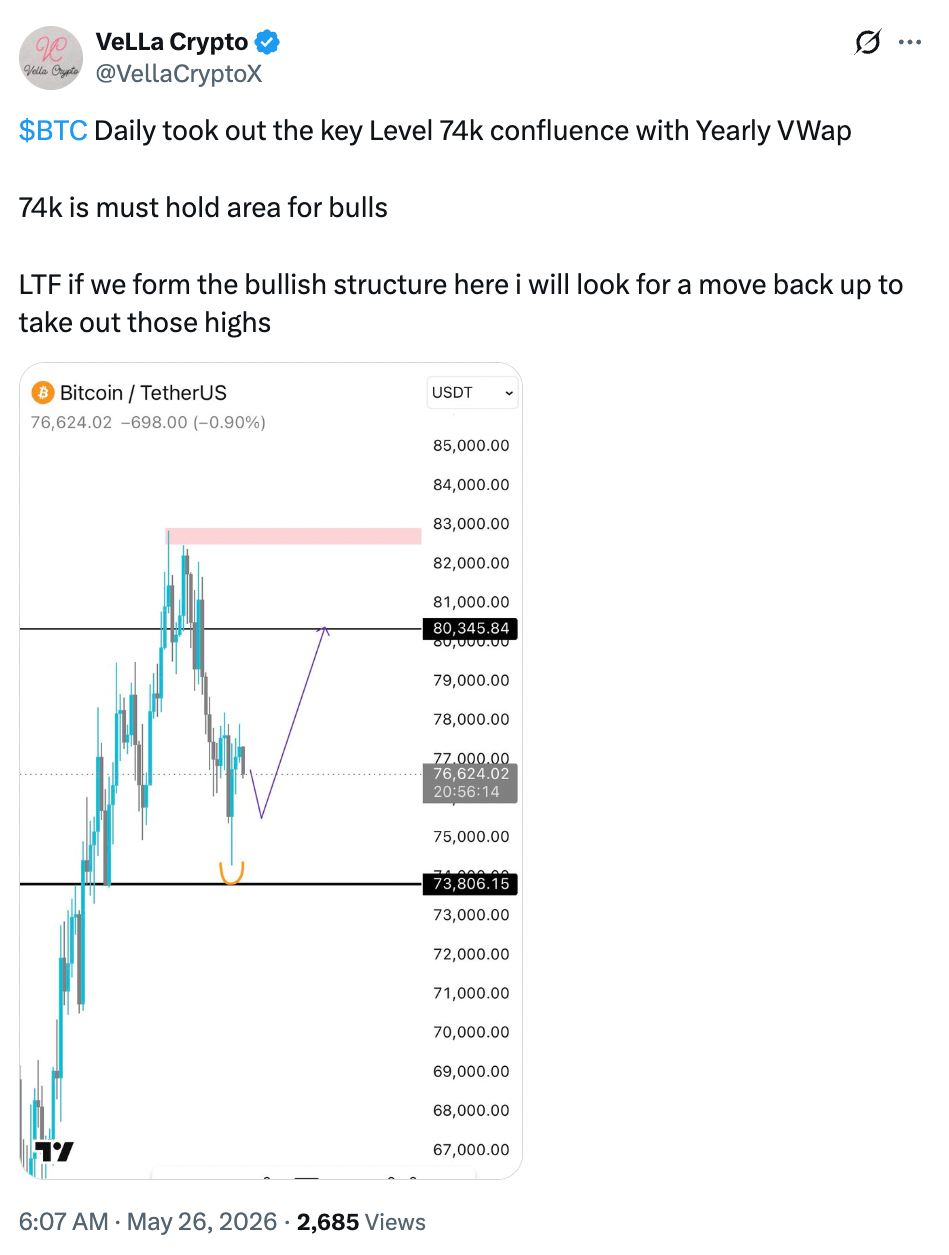
BTC/USD daily chart. Source: X/VeLLa Crypto
As Cointelegraph reported, a break below $74,000 would suggest the bears are back in control, invalidating the medium-term bullish outlook for Bitcoin.
Bitcoin spot volume collapses 81% on Binance
Bitcoin’s spot volume has now fallen to levels typically seen during bear markets, data from CryptoQuant shows.
The chart below shows that the trading volume on Binance has dropped to $36.4 billion, 81% below the $198.6 billion recorded in October 2025. Gate.io has also seen a massive 79.6% drop in volumes, while Bybit is down 66%.
“This development primarily reflects a macro environment that has been unfavorable for risk assets, CryptoQuant analyst Darkfost said in a Tuesday QuickTake post.
The decline in trading activity can also be “interpreted constructively” as it suggests that the” selling pressure behind the current retracement is gradually losing momentum.”
Darkfost added:
“It was precisely after spot volumes collapsed that the 2023 bear market came to an end, followed by the return of volatility and the recovery of the bullish trend.”
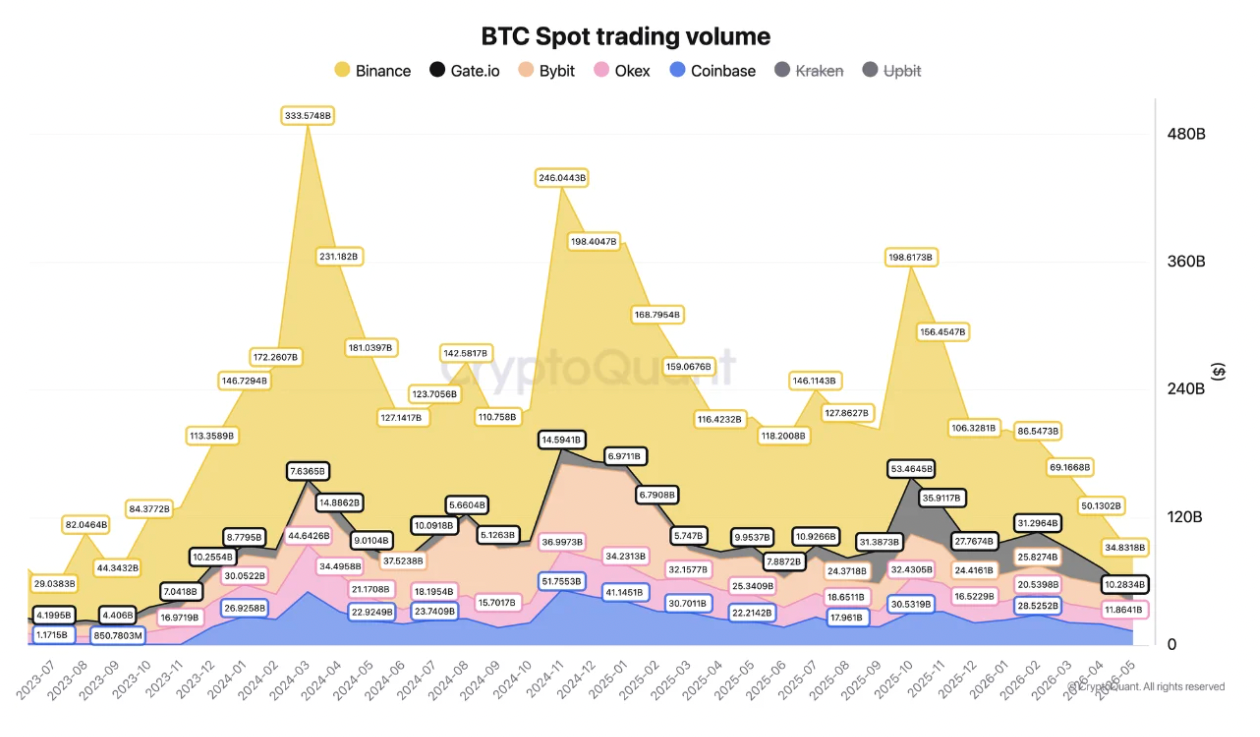
Bitcoin spot trading volume. Source: CryptoQuant
As Cointelegraph also reported, heavy outflows from spot Bitcoin ETFs have been correlated with great buying opportunities for BTC.