



Ether’s (ETH) exchange and derivatives data turned weaker over the past month. Binance recorded net inflows of 57,700 ETH, while futures open interest fell to a year-low of $10.3 billion from $15 billion, and the ratio of leveraged positions retreated sharply from their early June highs.
The combination of rising exchange supply, muted new participation, and declining futures activity has led ETH analysts to forecast another wave of selling pressure below $1,700.
ETH inflows on Binance outpace new demand
Crypto analyst Pelin Ay noted that roughly 57,700 ETH flowed into Binance on a net basis over the past few days. Large inflows to the exchange often signal potential selling since Binance is one of the most liquid exchanges in the crypto market.

ETH exchange inflows, new depositors and fresh supply. Source: CryptoQuant
At the same time, the number of new ETH depositors is around 320 addresses, well below the levels seen during previous demand surges. The muted participation suggests limited new capital entering the market, leaving recent price stability dependent on existing holders.
The analyst noted that supply growth continues to offer a counterbalance. Daily ETH issuance stands near 2,791 ETH, a relatively low figure since Ethereum’s EIP-1559 upgrade in 2021.
For now, exchange flow data paints a cautious picture. Ay said elevated net inflows raise the risk of another selling wave if Ether approaches resistance levels during any relief rally.
Related: BitMine boosts ETH holdings closer to $10B as bear market accumulation continues
Can Ether price defend its weekly demand zone?
ETH derivatives data have also cooled sharply in recent weeks. Ether futures open interest fell to $10.3 billion on Thursday from $15 billion a month ago, a decline of roughly 31%. The reading marks the lowest aggregate open interest across exchanges since April 2025.
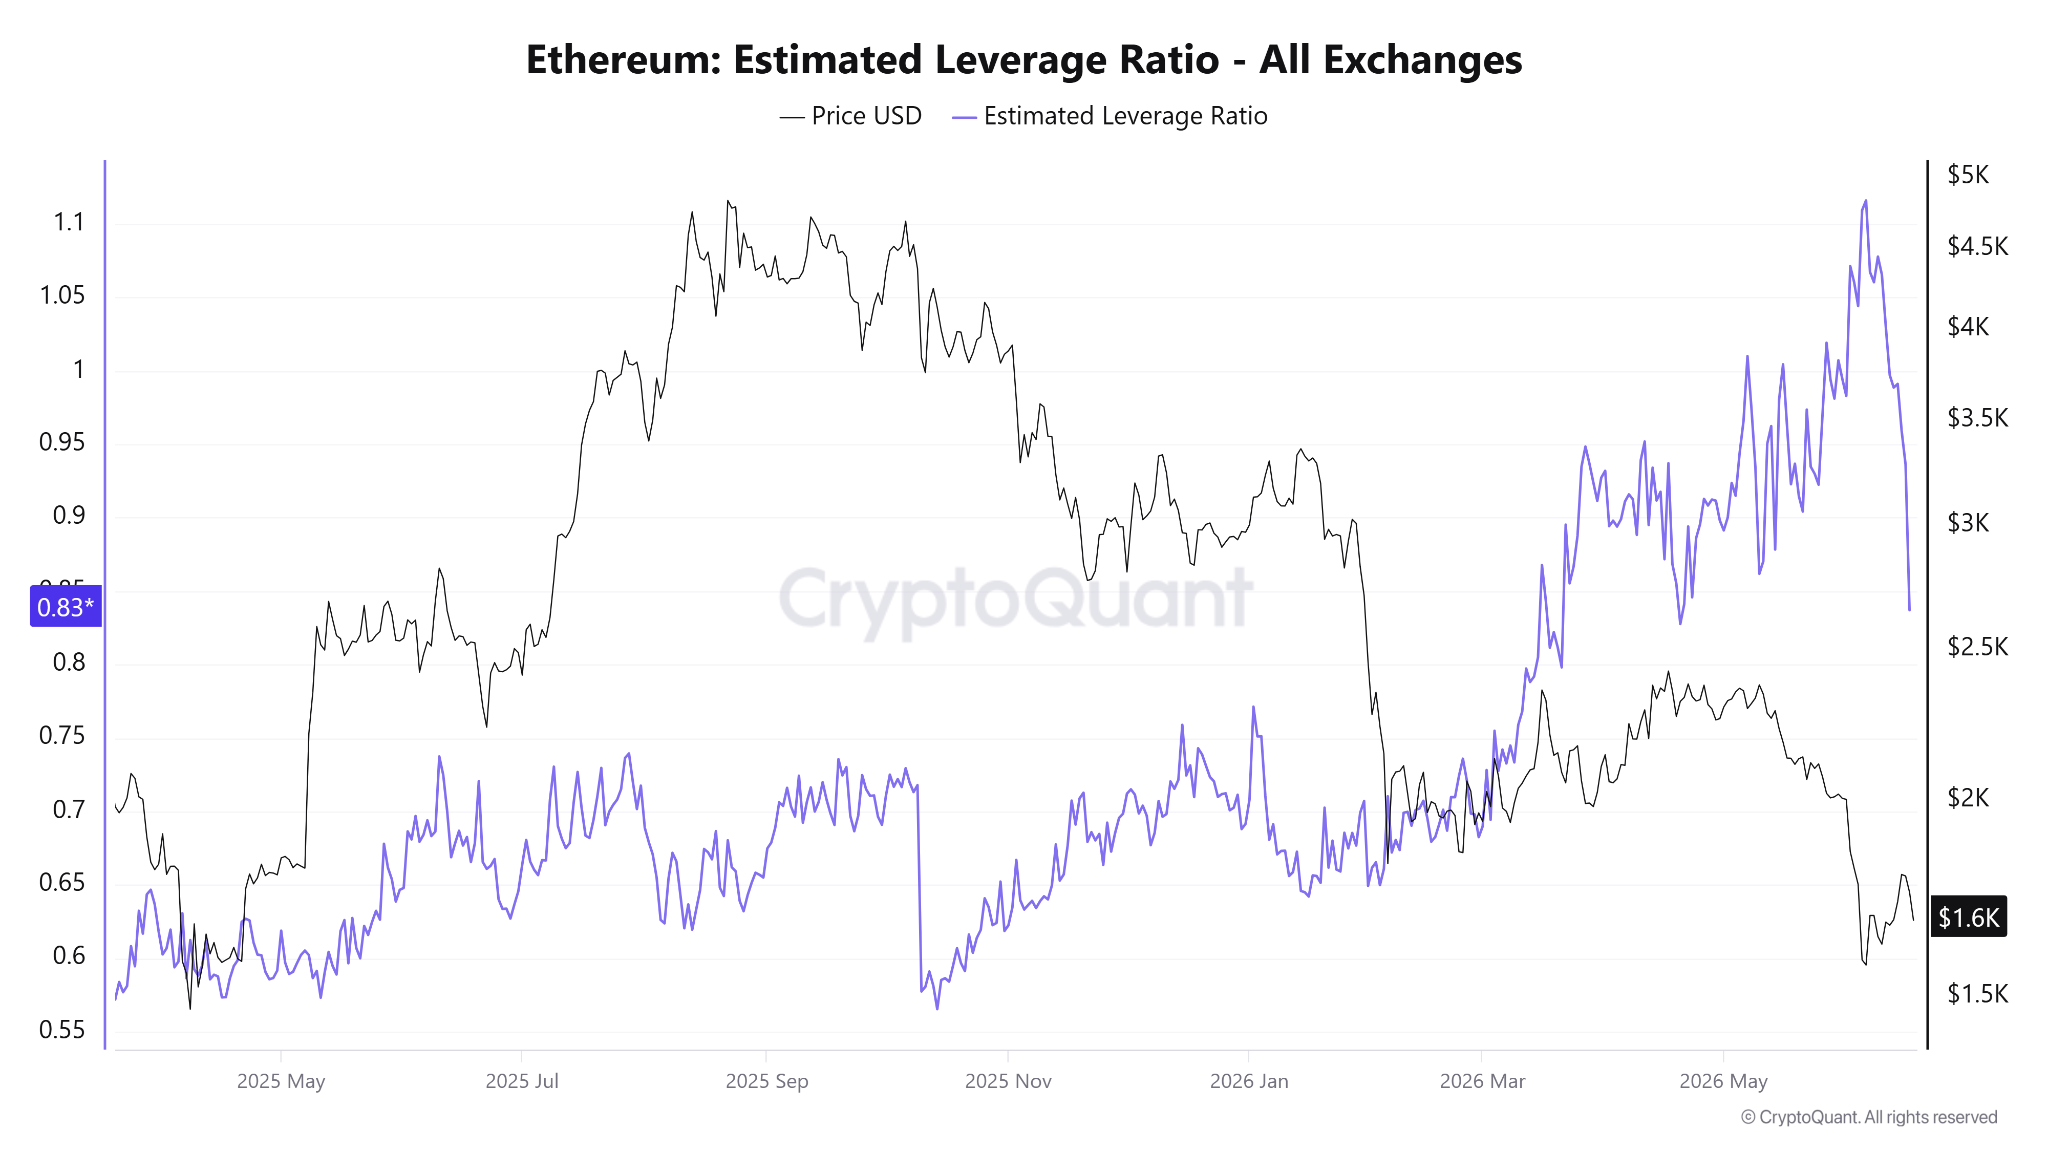
Ether estimated leverage ratio for all exchanges. Source: CryptoQuant
The number of leverage positions has also retreated at a similar pace. The estimated leverage ratio (ELR) dropped to 0.83 from an all-time high of 1.10 on June 2, marking its largest leverage unwind since October 2025, when the metric slid from 0.72 to 0.56.
Lower leverage often reduces the short-term volatility and speculative demand, but it also signals weaker conviction among traders.
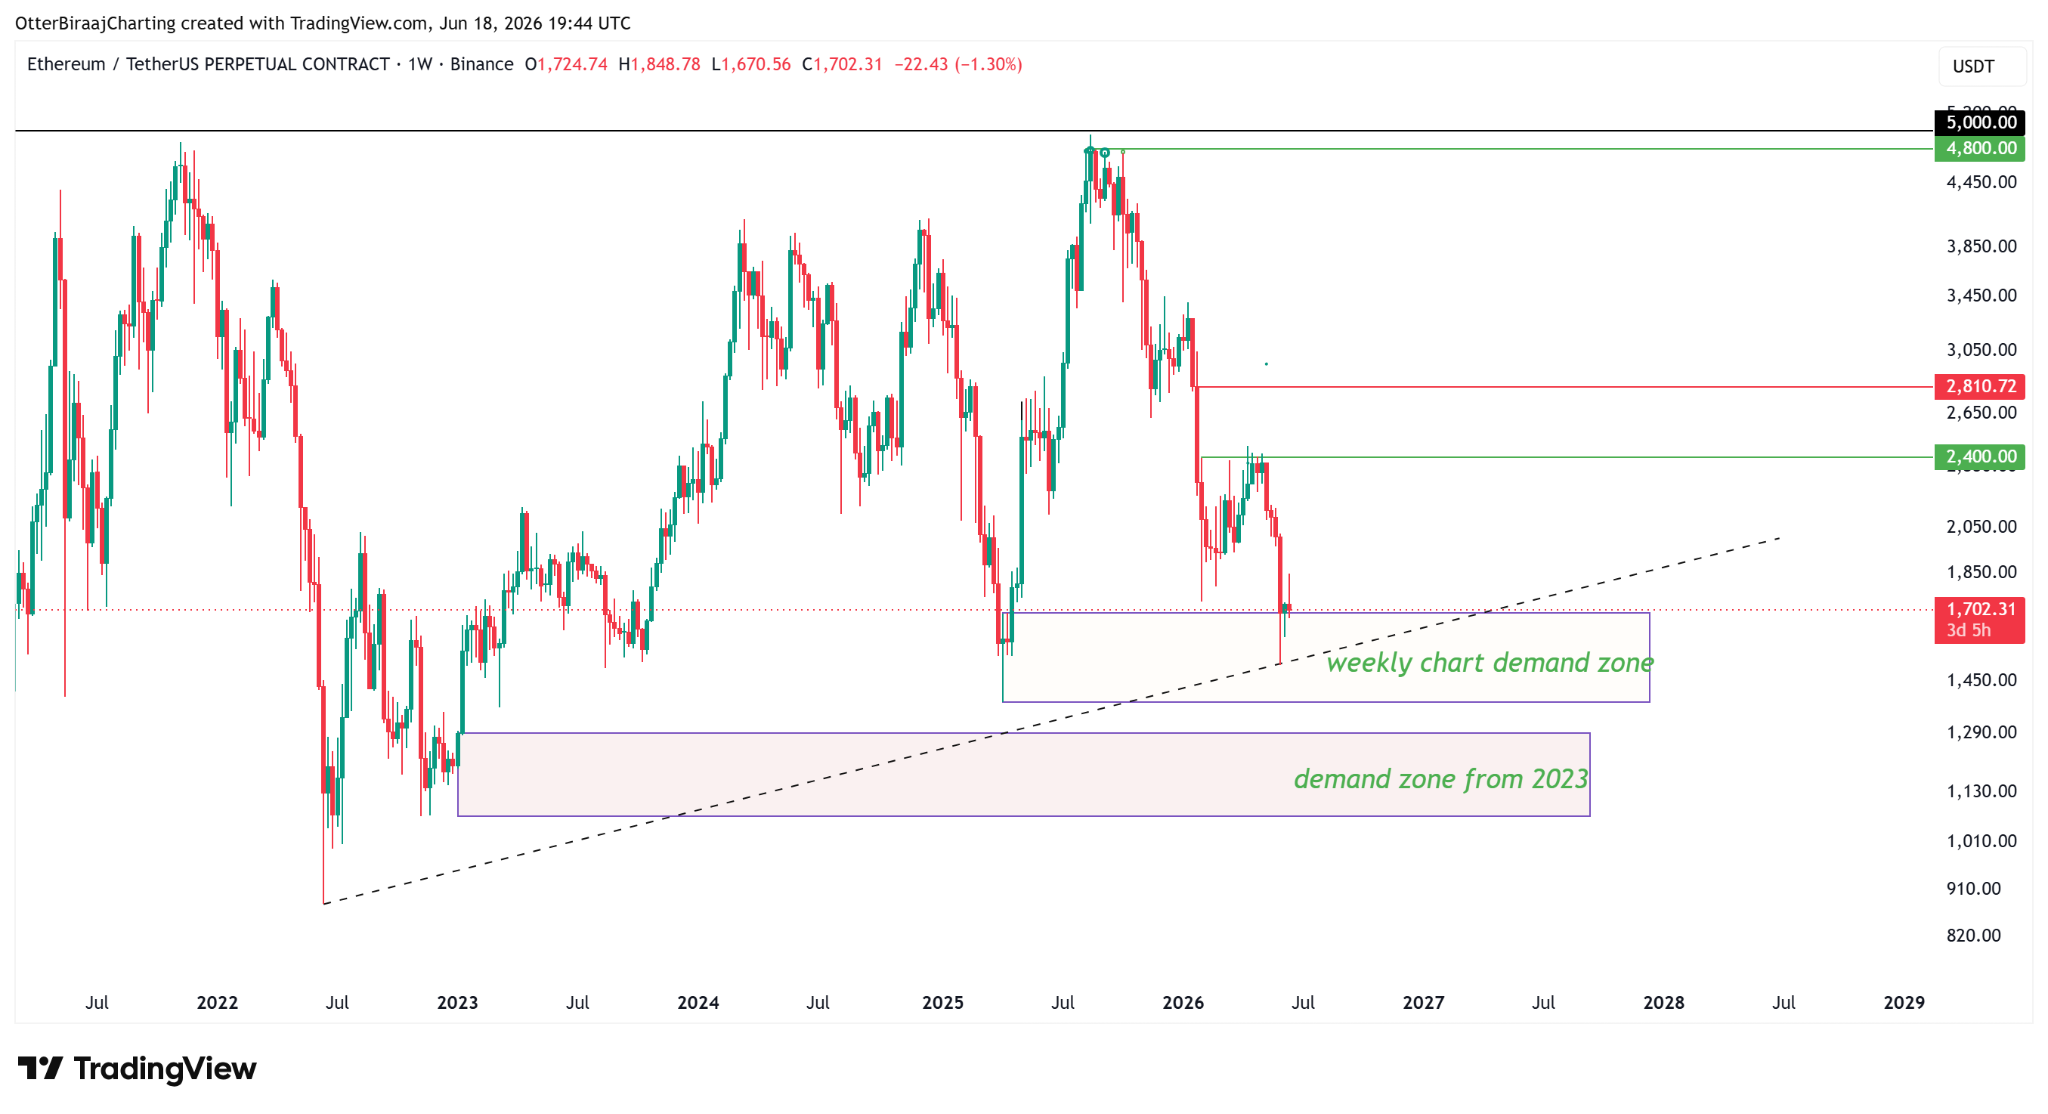
ETH/USDT, one-week chart analysis. Source: Cointelegraph/TradingView
Ether’s weekly chart is down 30% over the past 42 days and continues to trade near the demand zone of $1,700 and $1,400. The April 2025 low at $1,384 stands as the nearest external liquidity target if price weakness continues.
Below that level, the immediate area of interest is the demand zone from January 2023 between $1,289 and $1,071.
From a market standpoint, crypto trader Ardi said last week that some technical bottoming signals are emerging for the altcoin. ETH recently touched the lower band of a long-term acceptance range that previously coincided with macro lows.
The weekly relative strength index (RSI) sits near 31 after a daily RSI reading of 11 during the recent sell-off, its lowest level on record, which improves the chances of ETH bottoming in the current price range.
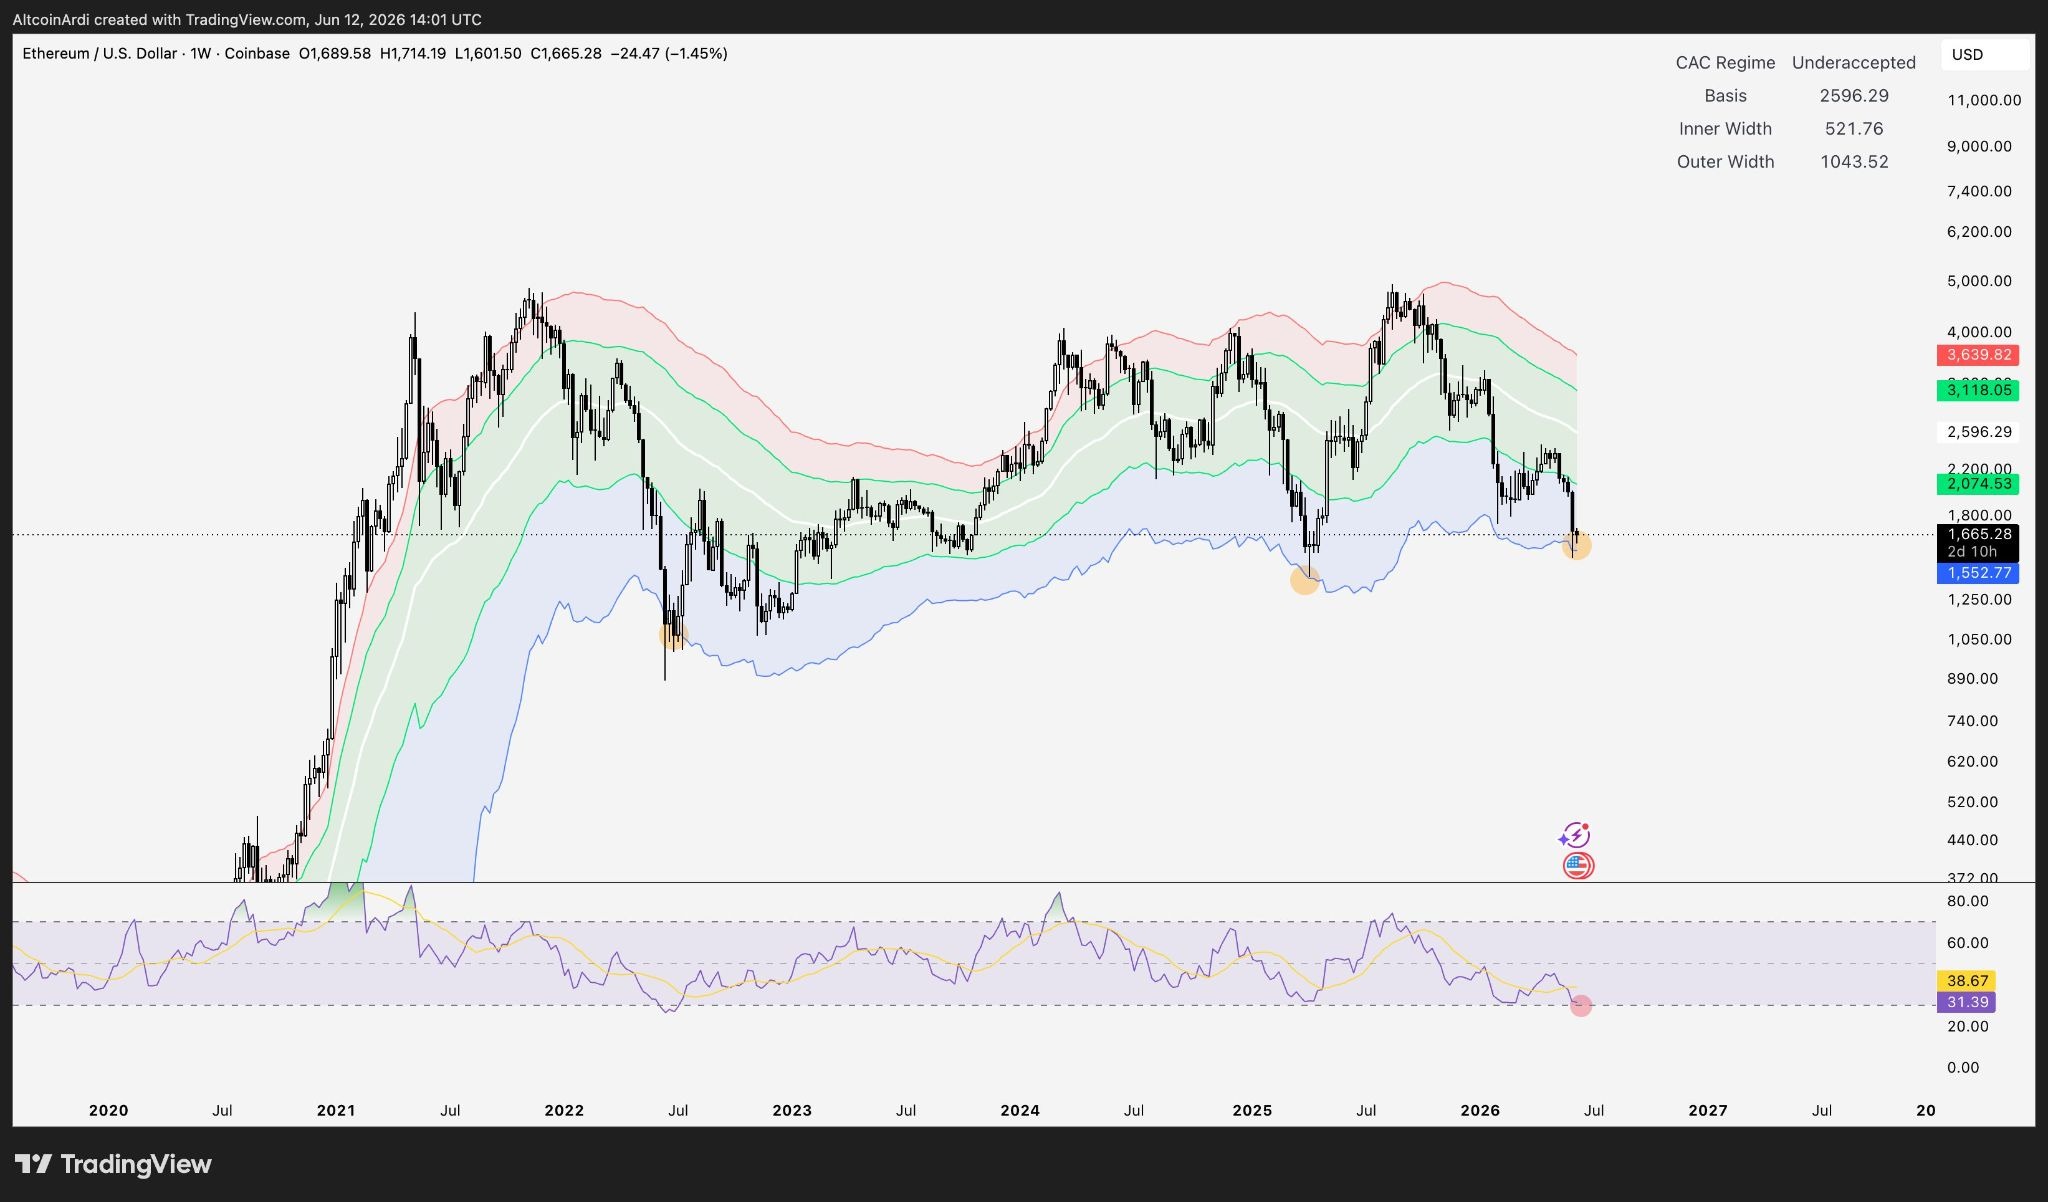
ETH/USD weekly analysis by Ardi. Source: X
Ardi added that ETH/BTC remains a key chart metric to monitor, as the pair continues to trend lower. For now, the $1,400 to $1,700 range remains the area where buyers and sellers are most actively positioned.
Related: Altcoin selling tops $266B as capital rotates out of crypto: Is altseason extinct?