



Ether’s (ETH) 33% rally from its sub-$1,800 multi-year lows appears to be cooling, but several key metrics suggest the top altcoin may be primed for a bigger rally toward $6,000 or higher.
Key takeaways:
- Ether is currently displaying a technical setup similar to past cycles that ignited a massive rally in ETH price.
- Supply squeeze potential is growing as increasing accumulation and exchange outflows reduce immediate sell pressure.
- A rising Coinbase premium reflects the return of US institutional demand.
Ether’s fractal targets a $6,000 ETH price
Ether is currently bouncing off a multi-year trend line that has historically marked macro ETH price bottoms. Previous instances in April 2025 and mid-2022 resulted in 260% and 130% ETH price rallies, respectively.
“$ETH is holding a long-term ascending trendline support,” analyst CryptoJack said in a recent X post, adding:

“Will history repeat itself?”
ETH/USD weekly chart. Source: Cointelegraph/TradingView
A bullish cross from the moving average convergence divergence (MACD) indicator also confirmed the price bottom.
“$ETH weekly MACD bullish cross is now confirmed,” analyst Ash Crypto said in a recent X post, adding:
“The last 2 times this happened, ETH pumped 183% and 75%.”
The weekly RSI is meanwhile recovering from levels that marked previous macro lows, suggesting that Ether’s recent drop to $1,750 was the bottom.
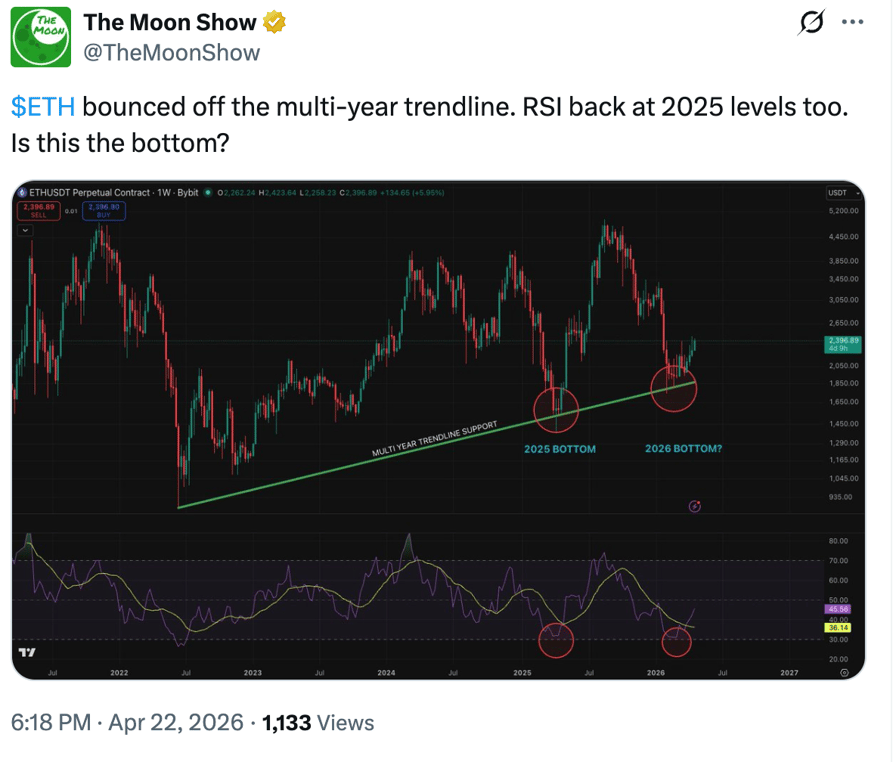
ETH/USD weekly chart. Source: The Moon Show
Ether’s current price action is following a similar pattern, with the price again bouncing off the same structural support, a confirmed bullish MACD crossover, and the RSI’s recovery from oversold conditions.
If history repeats itself, ETH may rally by between 75% and 260% from the bottom, placing Ether’s upside target at $3,000-$6,300.
ETH supply squeeze potential rises
Ethereum’s on-chain metrics reveal a tightening supply dynamic, an occurrence that has previously ignited significant ETH price rallies.
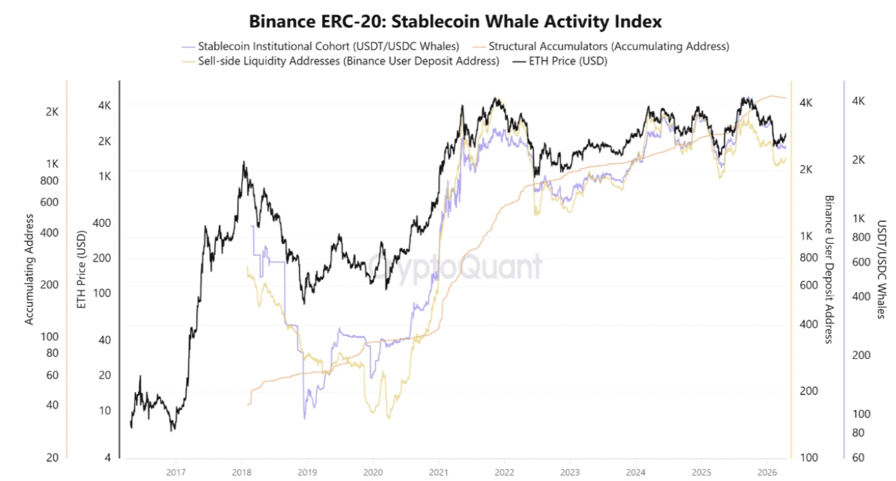
The Binance ERC-20: Stablecoin Whale Activity Index indicator reveals structural supply exhaustion.
The chart below shows that the number of daily accumulation addresses (wallets steadily buying ETH) has increased to 2,434, surpassing the number of exchange depositing addresses (wallets preparing to sell), which has dropped to 2,300.
This shift suggests that large players have moved from a “wait-and-see” phase into active accumulation, CryptoQuant analyst GugaOnChain said in a recent QuickTake analysis.
“This scenario is extremely positive for the price structure, as it reveals that there are significantly fewer addresses sending ETH to the exchange with the intention to sell than players accumulating or positioned to absorb liquidity,” the analyst said, adding:
“The supply shock is fully underway.”
Binance ERC-20 stablecoin whale activity index. Source: CryptoQuant
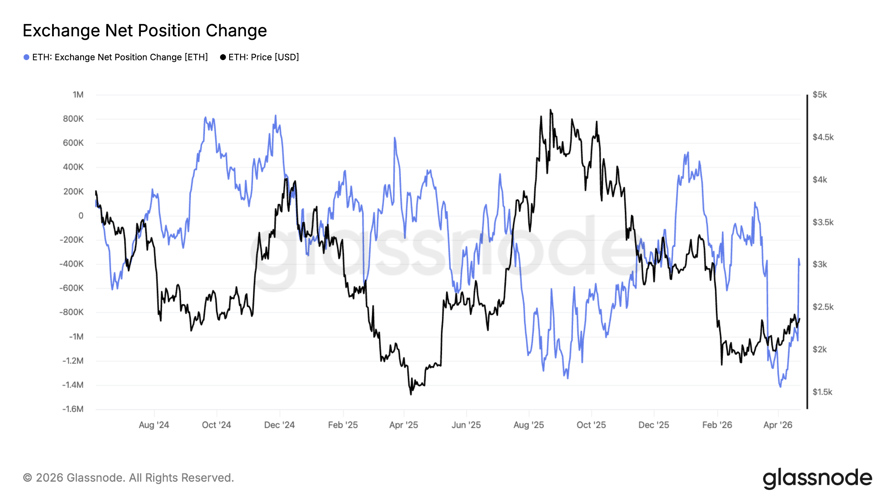
This is also seen in increasing exchange outflows, as the ETH net position change among exchanges for the past 30 days fell by 1.4 million ETH on April 2, marking the largest spike in seven months, according to Glassnode data.
The net position change is at -351,300 ETH (30 days) at the time of writing on Thursday.
ETH: Exchange net position change. Source: Glassnode
Such outflows typically indicate strong accumulation by large holders, who move tokens to cold storage or invest in investment products, thereby reducing immediate sell pressure.
This is usually referred to as a “supply squeeze,” conditions that have, historically, preceded sharp upside moves, especially when combined with improving market sentiment.
Ethereum demand recovers
As Cointelegraph reported, Ether futures on Binance have risen to a near two-month high as aggressive buyers stepped into the market over the past week. Buy-taker volume rose above $5 billion, and the current setup leans bullish.
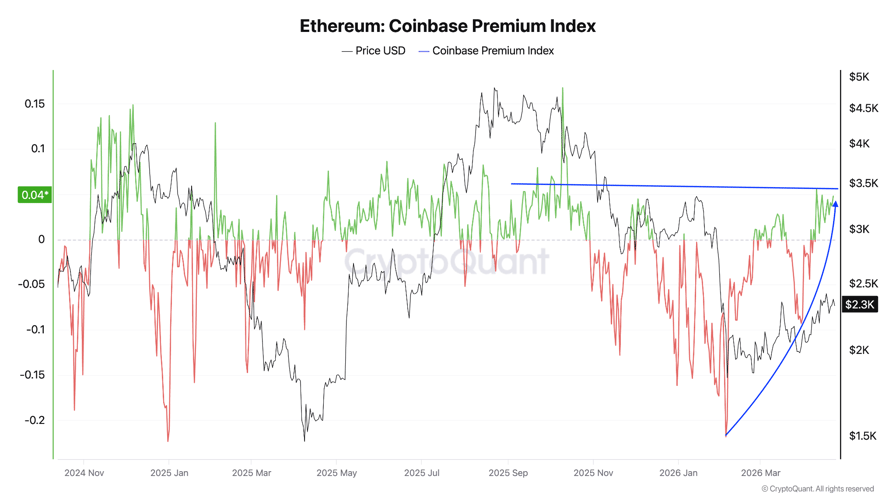
The US market is driving a significant share of this demand, as measured by the Coinbase premium index.
The ETH Coinbase premium index measures the price difference between the ETH/USD pair on Coinbase and Binance.
This metric flipped positive on April 4, rising to 0.055 on April 14, its highest level since October 2025. The index fell to as low as -0.21 in early February and has now recovered to 0.04.
This typically signals increased demand from institutional investors, particularly in the US market.
Ethereum Coinbase Premium Index. Source: CryptoQuant
Meanwhile, spot Ethereum ETFs have recorded net inflows for 10 consecutive days, totaling $590 million. This marks the longest inflow streak since December 2024, accompanying a 95% ETH price rally in Q4 2024.
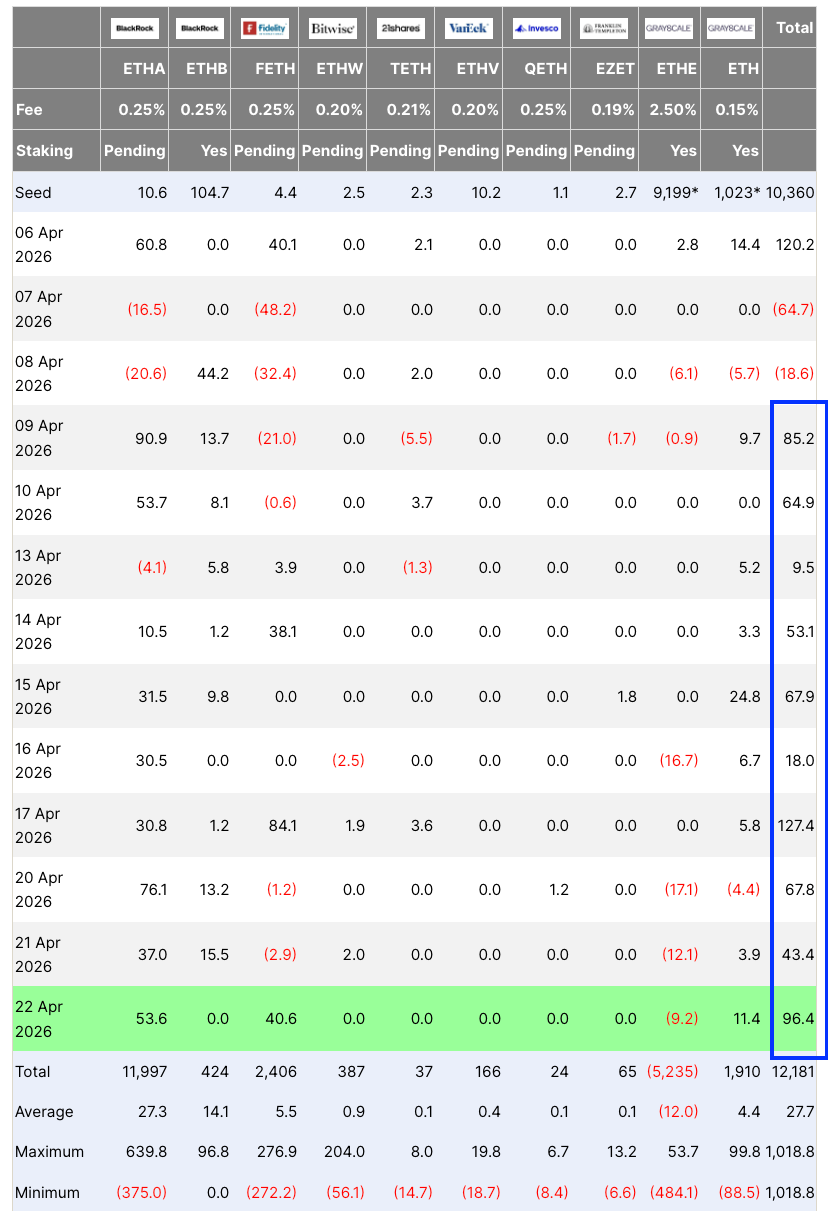
Spot Ethereum ETF flows table. Source: SoSoValue
Meanwhile, Bitmine Immersion Technologies, the world’s largest public holder of Ether, increased its holdings last week with another 101,627 ETH purchase, reflecting a return of demand for ETH among institutional investors.