



Market analysts say Ether (ETH) still faces “downside pressure” that could trigger another ETH price sell-off as traders shift their focus to support at $1,800.
Key takeaways:
- Ether faces downside pressure as elevated leverage and positive funding rates amid falling prices signal fragile market conditions.
- Analysts say ETH must hold the $1,800-$1,750 support zone to avoid a deeper correction.
Ether price metrics suggest downside risks remain
Analysts have highlighted several reasons for Ether’s potential to drop lower, including an elevated estimated leveraged ratio and positive funding rates amid a “weakening price structure,” according to CryptoQuant analyst PelinayPA.
The chart below shows that Ether’s estimated leverage ratio (yellow line) remains relatively elevated at around 0.74.

Related: Ether bears at risk of $2B squeeze as short positions build around $2K
The funding rate (blue line) has remained mostly in positive territory since mid-April, meaning long positions still dominate the market. Meanwhile, the RSI (purple line) is closer to the oversold zone at 31 and has not yet “produced a convincing recovery signal,” the analyst said in a Friday QuickTake analysis.
“Leverage remains elevated and long positioning is still dominant, yet price continues to struggle as the RSI reflects weakening momentum,” the analyst said, adding:
“Overall this combination suggests that short term downside pressure in the ETH market still remains the dominant structure.”
ETH: Funding rates and leveraged ratio
Under normal market conditions, rising leverage and increasing funding rates are usually supported by strong price expansion. However, in this case, leverage remains high while price continues to record lower lows.
“But the key signal is that this leverage build-up came alongside heavy sell-side pressure,” fellow analyst Amr Taha said in another QuickTake note.
The chart below shows that the Binance cumulative net taker volume fell to around -$744 million, its deepest negative reading since April 6, 2026.
Amr Taha added:
“This means new leverage entered the market while aggressive sellers were still in control, making the setup more fragile than a clean bullish open-interest expansion.”
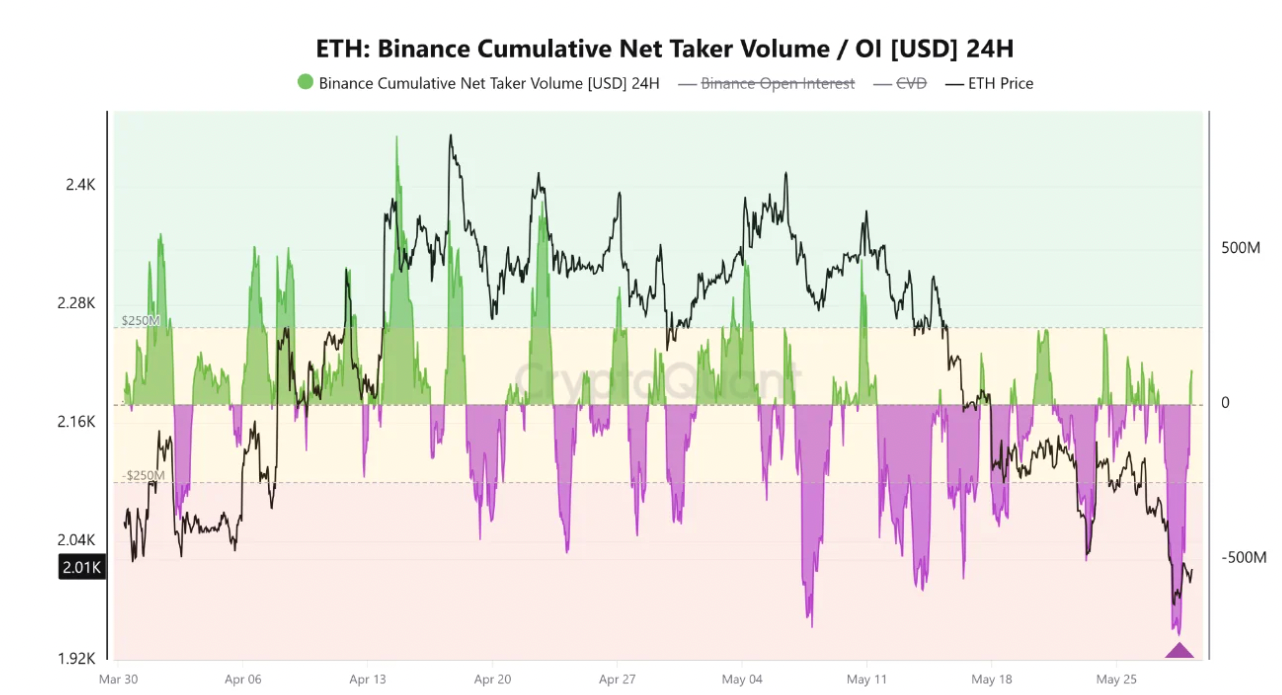
ETH: Cumulative net taker volume on Binance. Source: CryptoQuant
This suggests that the market structure is driven by derivative positioning instead of spot demand, which creates a weaker overall setup.
Waning demand is also seen in US-based spot Ethereum exchange-traded funds (ETFs), which continue to post heavy outflows, indicating declining institutional interest. These ETFs have recorded outflows for thirteen consecutive days, totaling $695 million. The $121 million in net outflows recorded on Thursday marked the largest withdrawal in two weeks.
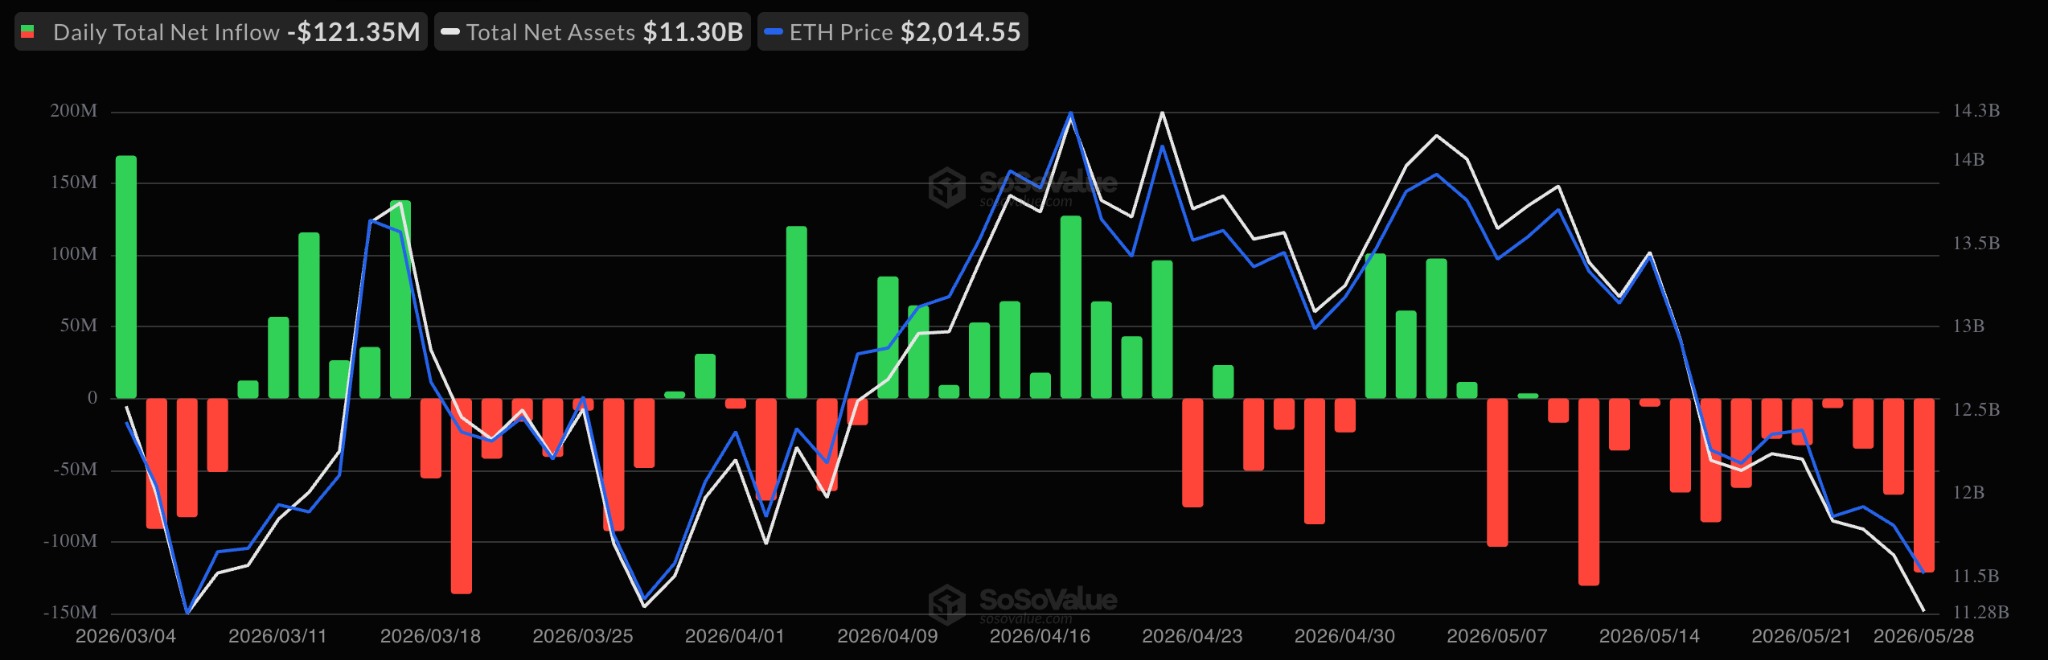
Spot Bitcoin Ether flows chart. Source: SoSoValue
As Cointelegraph reported, a break below the crucial $2,000 support and increased selling by whales indicate additional downside risk for ETH price in the near term.
Ether price must hold above $1,800
Ether’s 7% drop over the last three days has seen it lose the crucial $2,000 support, as the bears gained momentum.
Traders are now watching key levels on the downside, including the $1,800 demand zone.
“A good spot buy would be around $1,700-$1,800 key area,” analyst Suraj Jha said in a Friday post on X, adding:
“A confirmed breakdown below this level could shift the structure bearish and open up continuation to the downside.”
Fellow analyst Crypto Patel said Ether’s technical structure remains “bearish until we reclaim $3050.”
The ETH/USD pair “needs to hold $1,750 to keep the long-term bullish case alive,” the analyst said, adding:
“If $1,750 breaks, accumulation zone 2 sits at $,1500-$,1400, a massive discount for long-term holders.”
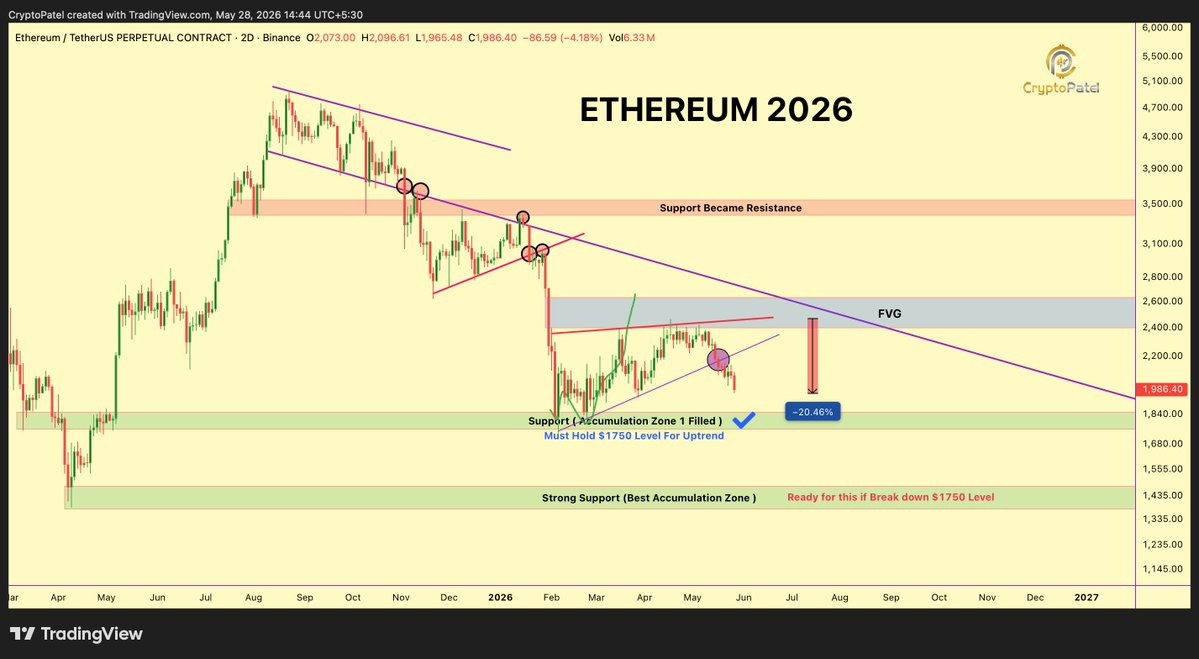
ETH/USD two-day chart. Source: X/CryptoPatel
A daily candlestick drop below $1,750 could trigger another sell-off episode, first toward the April 2026 low at $1,550 and later to the 2022 macro low around $1,000, as shown on the daily chart below. This would bring the total losses to 47% from the current price.
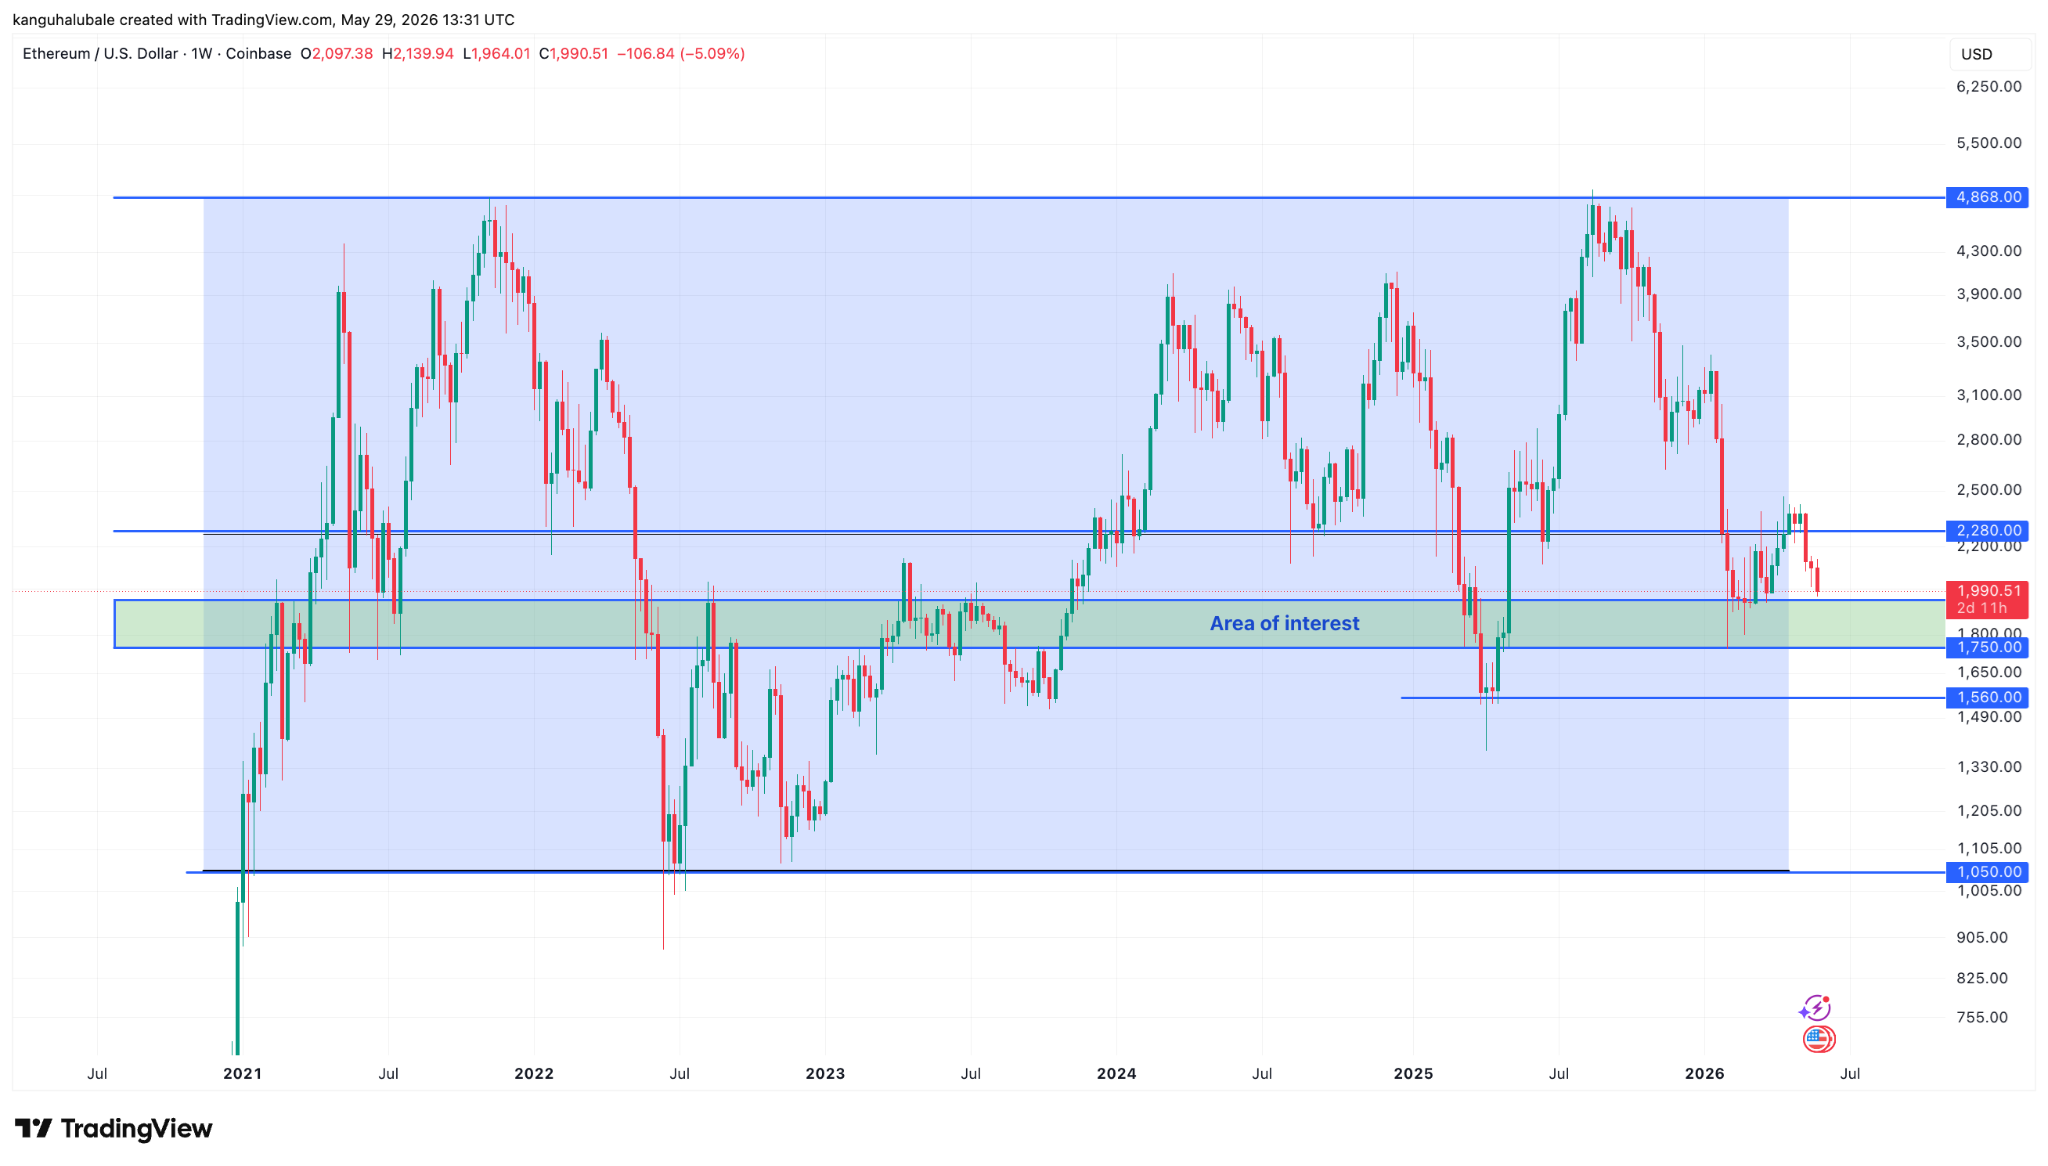
ETH/USD weekly chart. Source: Cointelegraph/TradingView
As Cointelegraph reported, after losing the psychological support at $2,000, the ETH/USD pair may then descend toward the $1,900-$1,750 zone, which buyers are expected to defend aggressively.