



A crypto analyst has projected just how low Bitcoin (BTC) could fall during this market cycle, sharing a timeline for a potential price bottom. The expert has based his bearish outlook on the Bitcoin 400-day cycle, a recurring pattern that has consistently appeared across multiple market phases. Drawing from this historical trend, he suggested that BTC could still face further downside in its current bear market before any long-term recovery stage begins.
Analyst Says Bitcoin Final Cycle Bottom Is In October
Crypto market analyst Bee has provided a definitive timeline for the end of the current Bitcoin bear market based on strict historical market trends. His analysis, shared on X, relies on a specific 400-day cycle pattern that has successfully guided market tops and bottoms across 13 years of BTC’s trading history.

Based on this framework, Bitcoin is now 252 days into its cyclical bear phase that historically lasts between 364 and 400 days. This suggests that the leading cryptocurrency market still faces an extra 112 to 148 days of severe downward pressure before a true recovery can begin.
Based on the timeline of this historical setup, Bee estimates that BTC’s absolute price bottom for this cycle could be in October 2026. His calculations, highlighted on his accompanying chart, suggest that Bitcoin could decline as low as $30,000 by the first week of the month. This would represent a more than 75% decline from current all-time highs near $126,000, marking the likely floor before the next recovery.
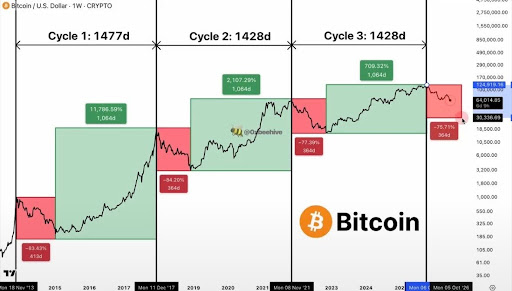
Notably, Bee mentioned that the historical 400-day bear market typically follows a bull run lasting about 1,064 days. This suggests that once a final cycle bottom is reached, the market could reset, potentially paving the way for a fresh bull market.
The analyst also warned that many investors may argue that the current market is different from past market trends due to Exchange-Traded Funds (ETFs), institutional involvement, or large players like BlackRock, the world’s largest Bitcoin ETF provider. However, Bee countered, noting that each past cycle had its own reasons for being “different,” yet the historical 400-day pattern persisted.
He emphasized that this recurring structure has played out without a single deviation for over a decade. The analyst also pointed out that the structure has consistently held through changing narratives and broader market developments, so there is no reason to believe the current cycle will be any different.
Expert Predicts Next Bottom And Rejects $100,000 BTC In 2026
In a separate but similarly bearish post, crypto analyst Ted Pillows has forecasted the timeline for Bitcoin’s bear market bottom. Pillows noted that Bitcoin took about 10 months to bottom after the monthly Moving Average Convergence Divergence (MACD) bearish cross emerged in 2022.
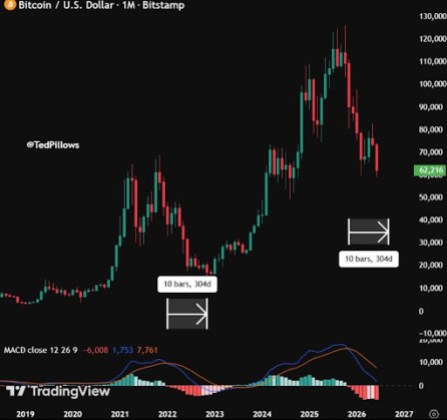
He noted that if a similar trend occurs again, then he expects BTC to reach its final price floor either by the end of the third quarter (Q3) of 2026 or the beginning of the fourth quarter (Q4). His chart pointed toward a likely bottom target between $30,000 and $40,000. Meanwhile, the analyst has crushed hopes for a long-term rebound this year, projecting that a bullish run back toward $100,000 is highly unlikely in 2026.
Featured image created with Dall.E, chart from Tradingview.com

Editorial Process for bitcoinist is centered on delivering thoroughly researched, accurate, and unbiased content. We uphold strict sourcing standards, and each page undergoes diligent review by our team of top technology experts and seasoned editors. This process ensures the integrity, relevance, and value of our content for our readers.