
The MicroStrategy stock price couldn’t continue its upswing despite the company continuing to buy more Bitcoin. Its latest $40 million purchase, on February 23, came just as the stock began sliding again. But that wasn’t the entire story.
While MSTR stock dipped by over 9% on February 24, a 16% bounce followed on February 25, showing excitement. At press time, it’s down over 3% since yesterday’s close. The stock is now down about 4% from last Friday’s high and almost 63% over six months, raising fresh concerns about a deeper breakdown, all while the BTC stash was loaded again.
Latest $40 Million Bitcoin Buy Fails to Stop MSTR’s Slide
MicroStrategy added 592 Bitcoin on February 23, spending about $40 million at an average price near $67,286. This pushed its total holdings to 717,722 Bitcoin, with an overall average cost basis of $76,020.
Normally, such aggressive buying supports investor confidence because it signals long-term conviction in Bitcoin’s future.

Want more token insights like this? Sign up for Editor Harsh Notariya’s Daily Crypto Newsletter here.
But at this time, the MicroStrategy stock price continued to fall rather than stabilize, moving steadily on its bear-flag breakdown path that started on February 19, despite a few rebounds. This weakness closely reflects Bitcoin’s own behavior.
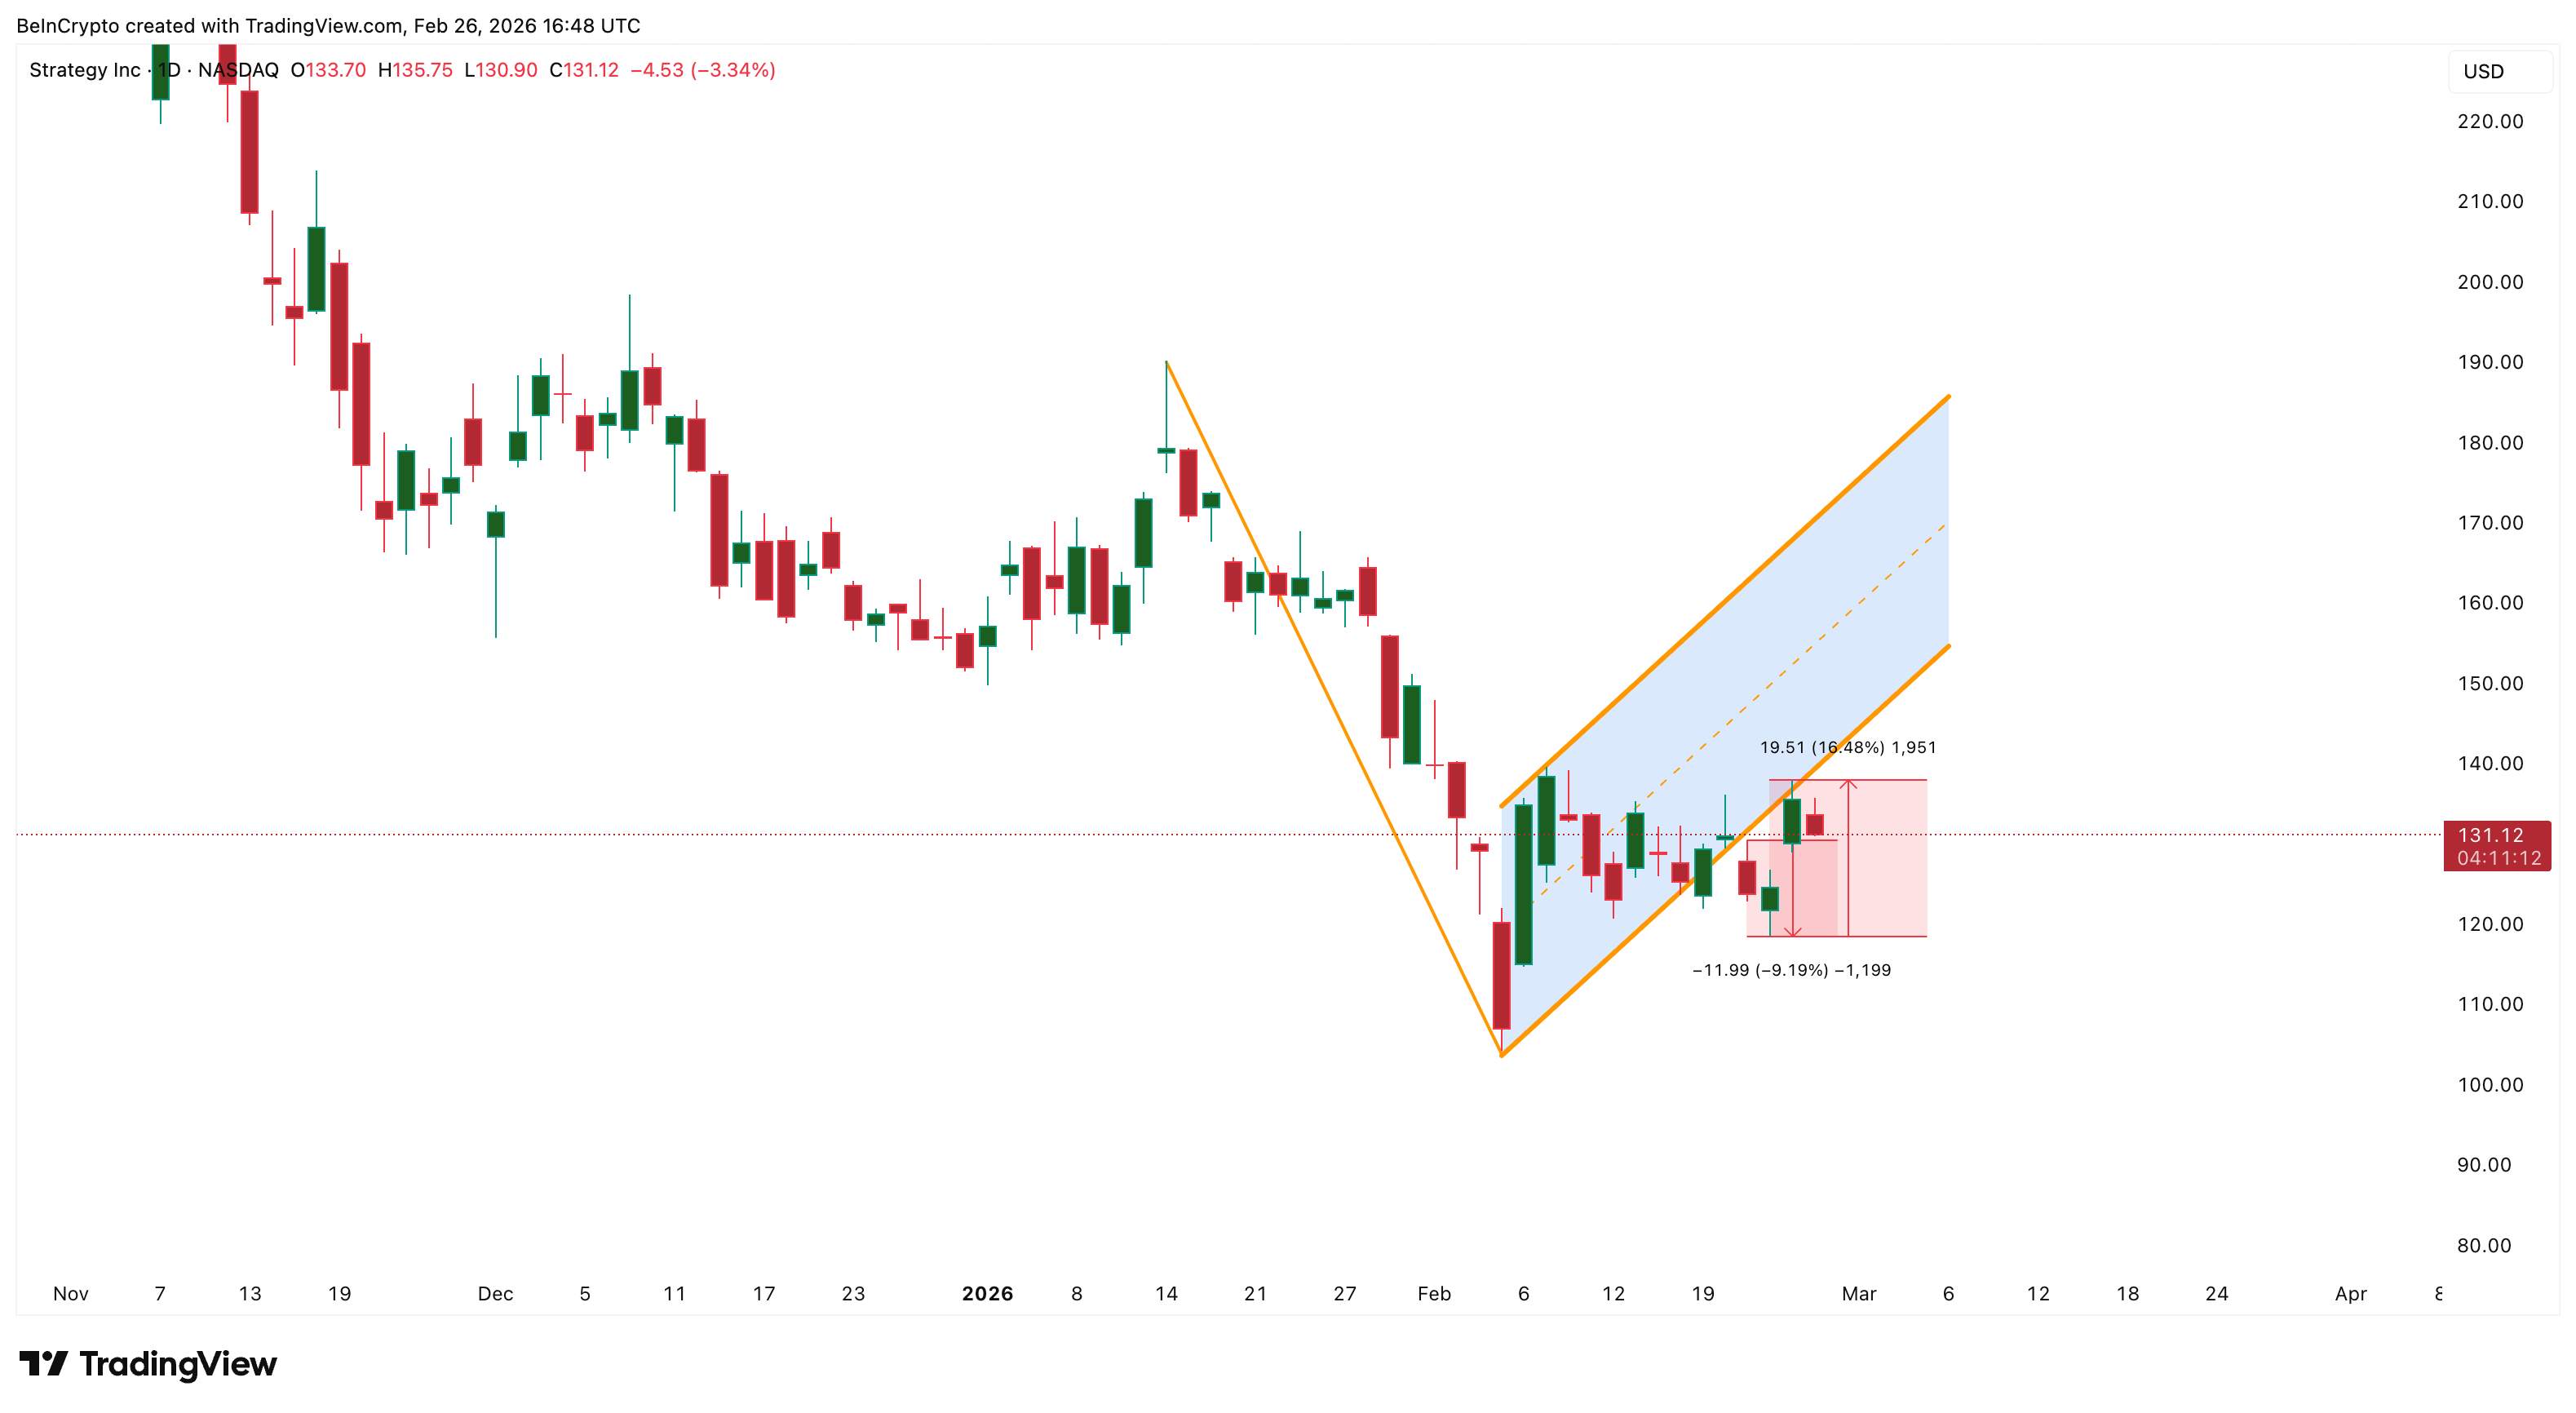
The stock had briefly rallied to $137 on February 25, riding Bitcoin’s rebound from $64,500 to $69,400, a 2.5% move. However, as Bitcoin cooled again, MicroStrategy immediately reversed lower, showing how tightly its performance remains tied to Bitcoin’s direction.
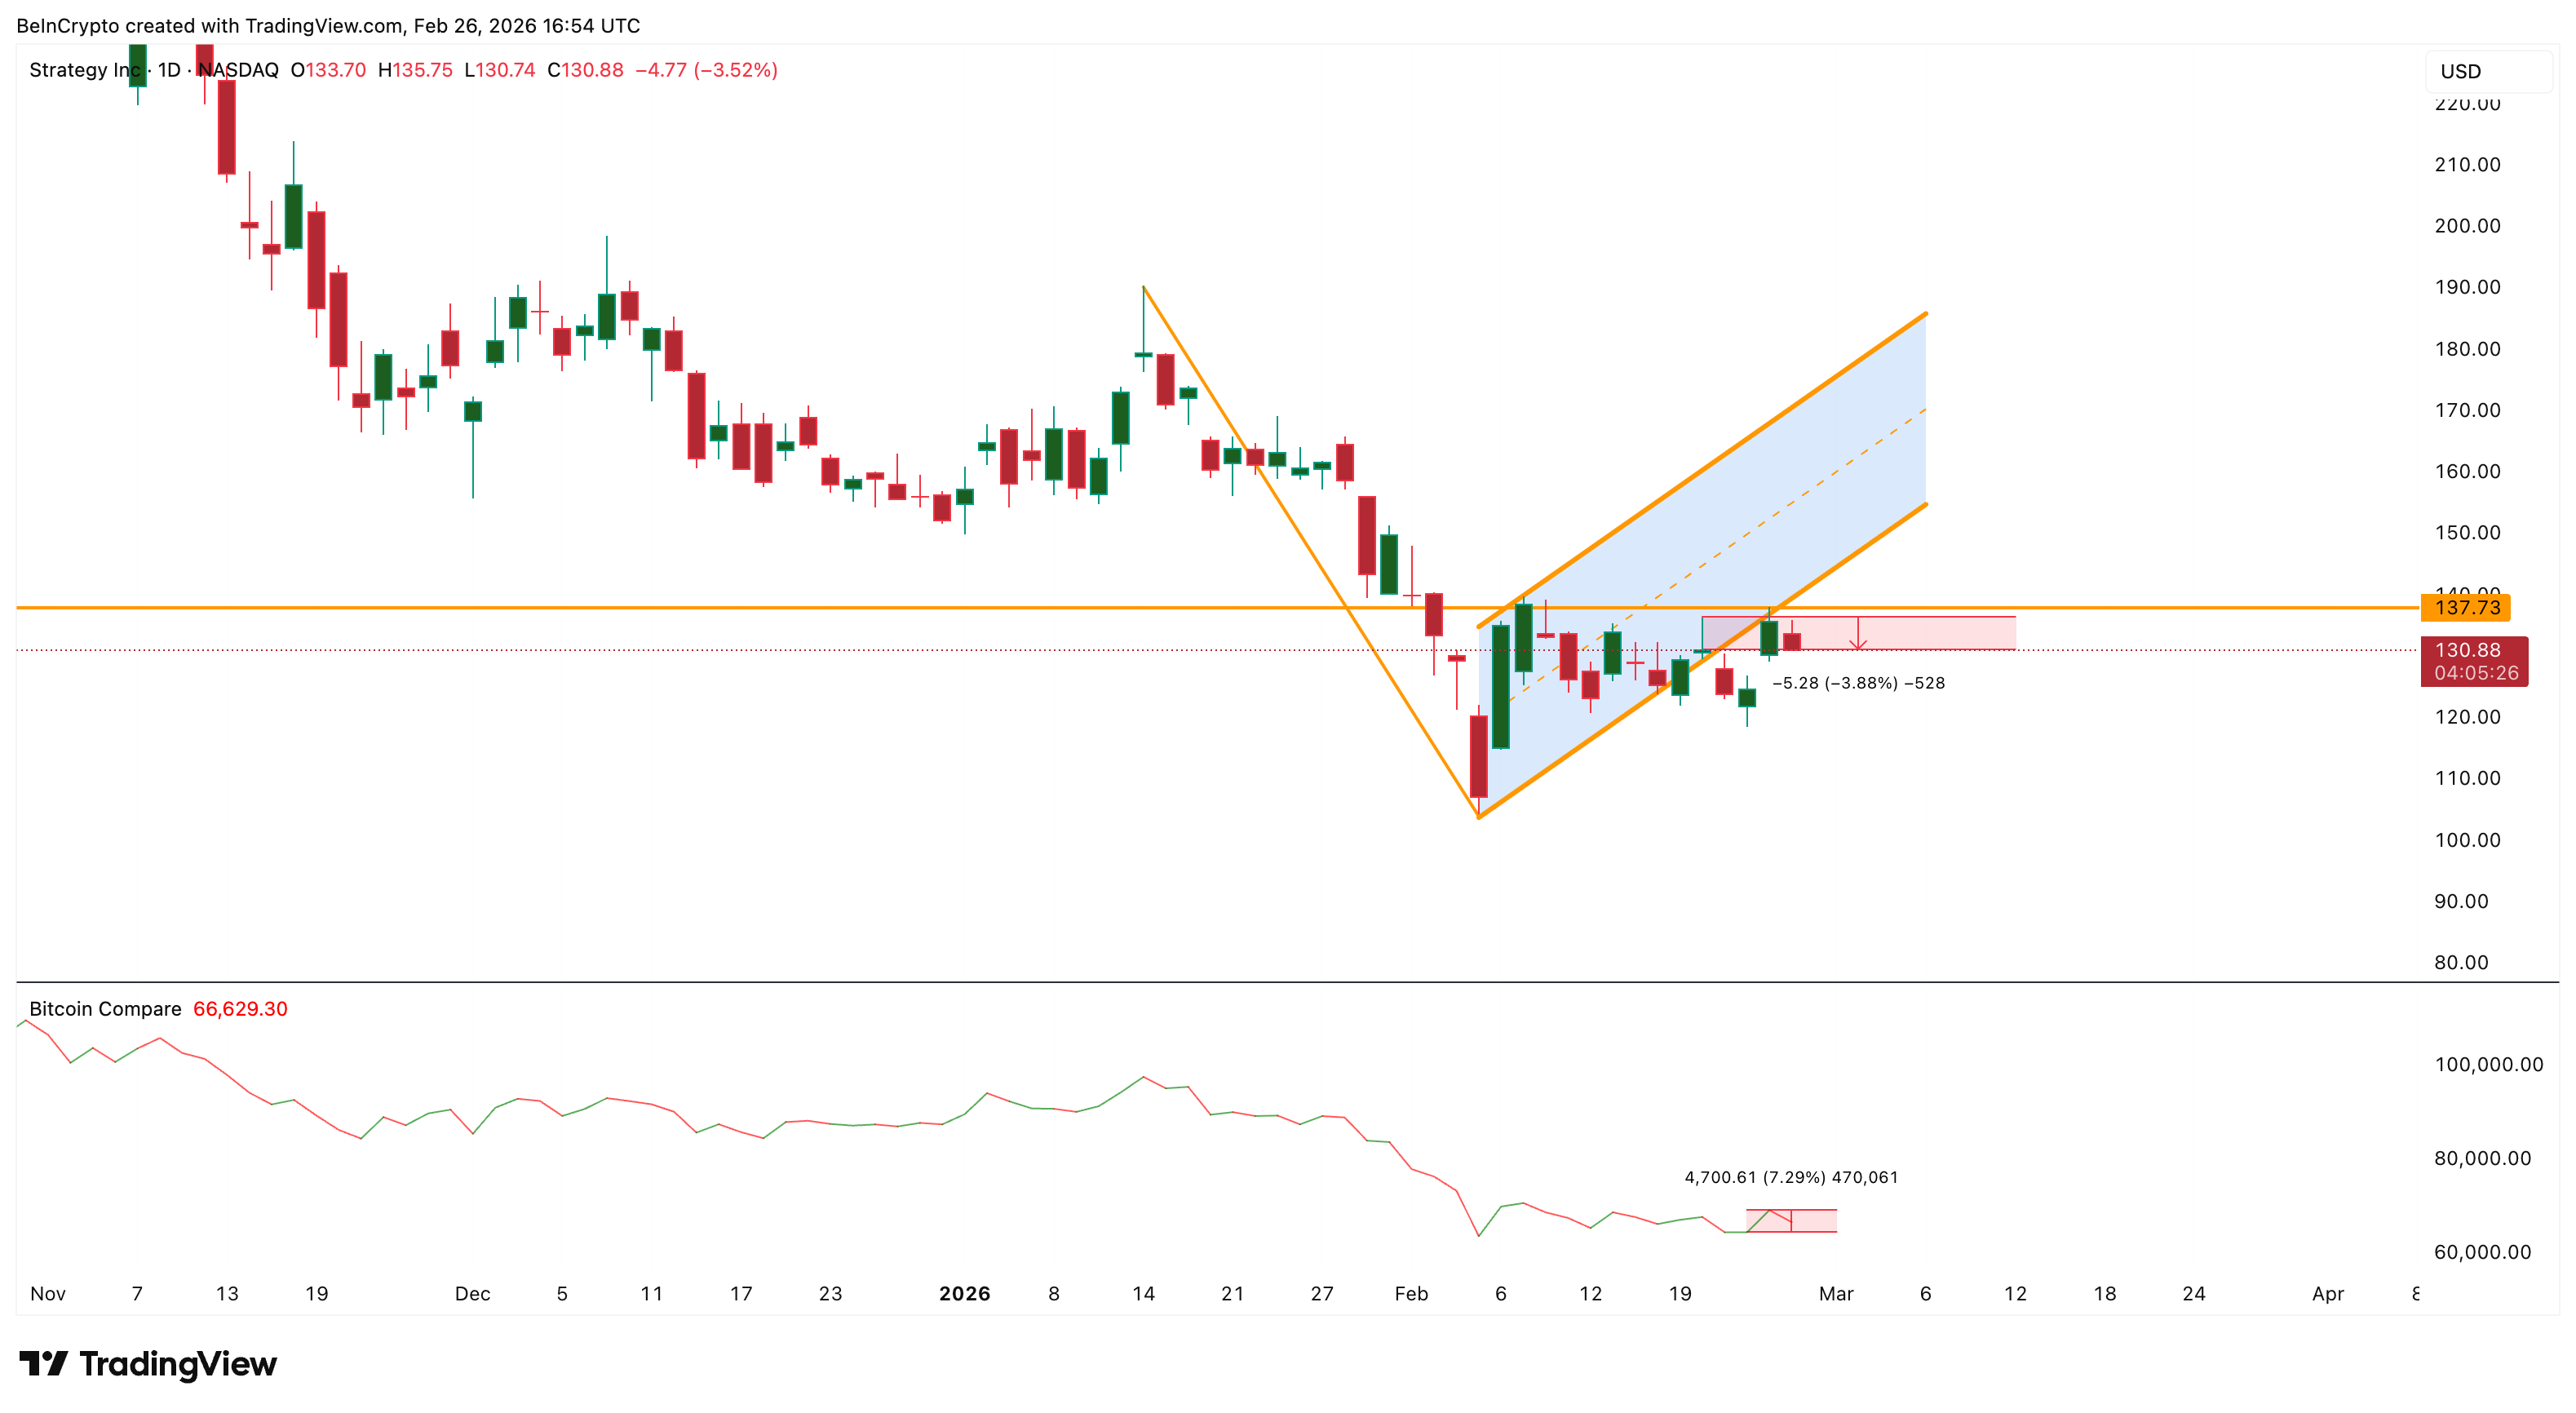
This shows MicroStrategy is still trading like a leveraged Bitcoin proxy. When Bitcoin pauses or weakens, MicroStrategy often falls faster because its valuation already assumes strong upside from its Bitcoin holdings.
The latest Bitcoin purchase did not change that dynamic, raising a more important question: whether institutional investors still support the stock.
Institutional Money Flow Signals Growing Exit Risk
The Chaikin Money Flow (CMF) indicator is now flashing a warning sign. CMF measures whether large investors are buying or selling by combining price and volume.
When CMF rises above zero, it signals accumulation, meaning institutional investors are buying. When it drops below zero, it signals distribution, meaning capital is leaving the asset.
Earlier, between January 12 and February 23, CMF rose while MicroStrategy’s stock price fell, with a few bounces above the zero line. This bullish divergence showed that institutional investors were quietly accumulating shares during weakness. That accumulation even translated into net positive flows at times, leading to sizeable rebounds.
It even helped fuel a 33% rebound between February 5 and February 25. However, the situation is different now. The CMF has flatlined, hugging the zero line. This shows institutional money is undecided at the moment.
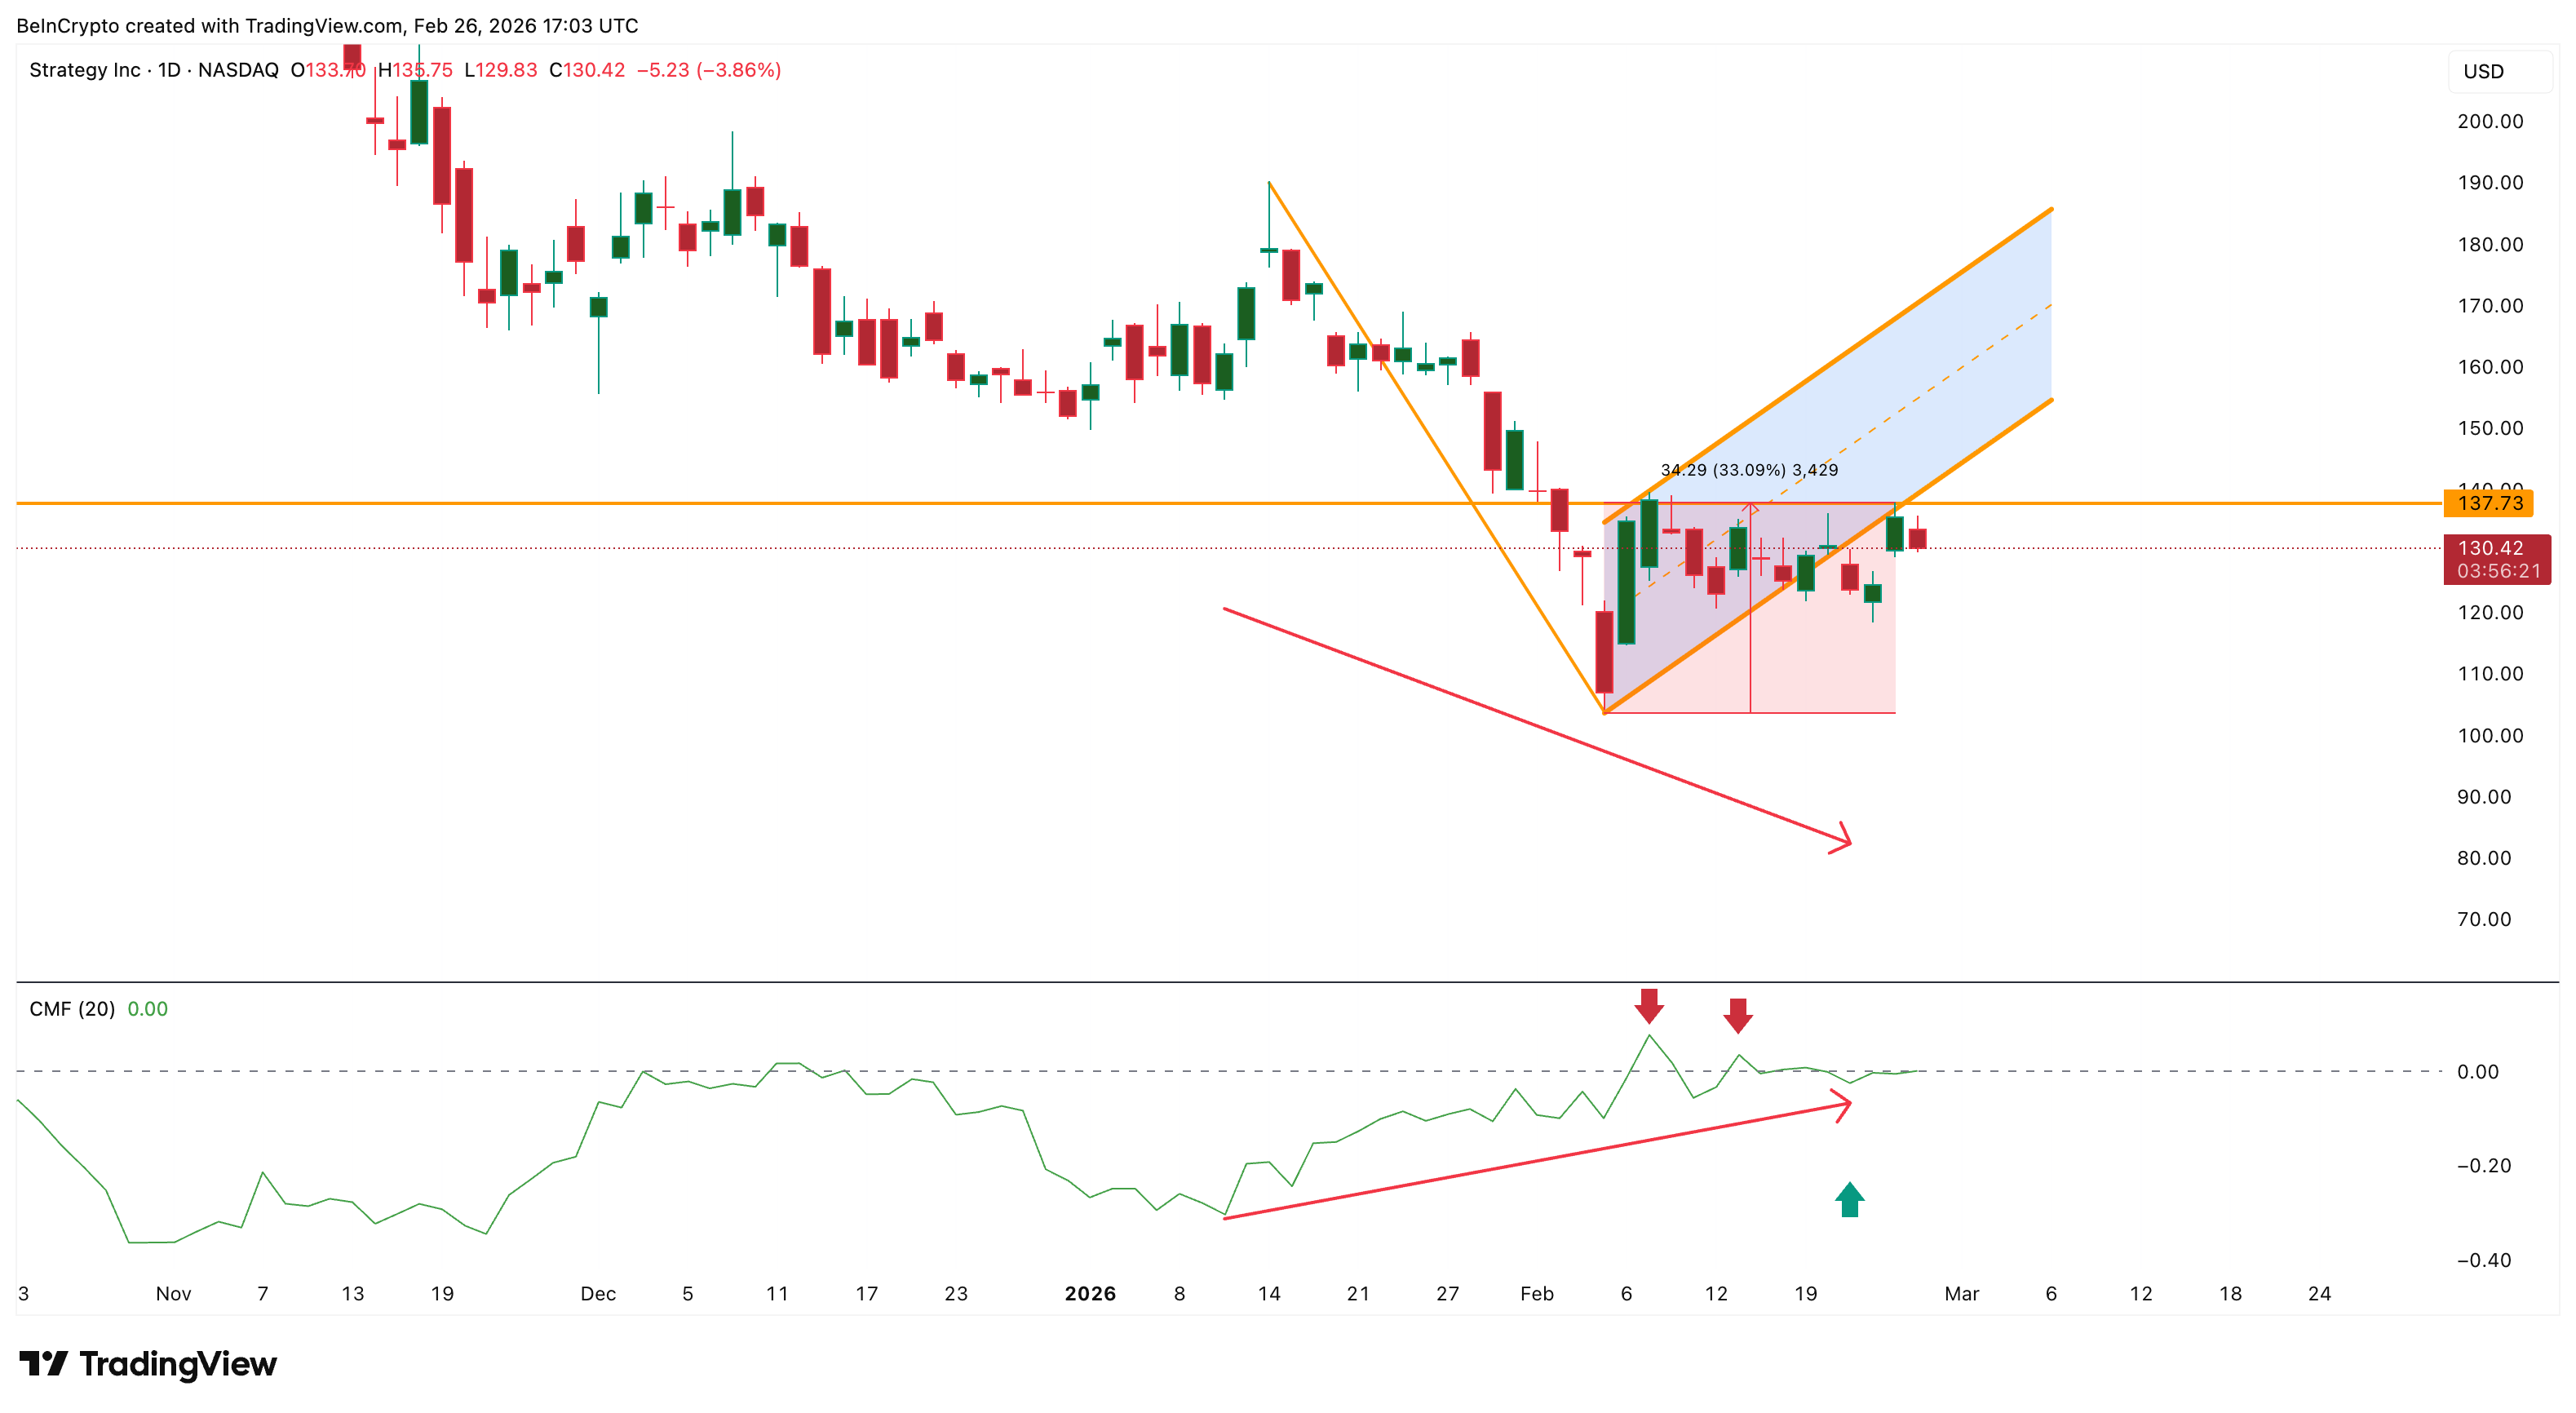
What’s troubling is that the shift happened immediately after MicroStrategy announced its latest Bitcoin purchase on February 23. CMF suggests institutional investors may not be accumulating MicroStrategy stock despite its Bitcoin buying.
This disconnect weakens the bullish case and suggests confidence in the stock itself may be fading. The next direction the CMF line takes might decide the fate of the MSTR stock price.
At the same time, momentum indicators show that the recent drop (between February 25 and February 26) was not unexpected, as underlying strength had already been weakening.
Bearish Divergence Warned of MSTR Stock Price Drop
The Relative Strength Index (RSI), which measures momentum strength on a scale from 0 to 100, showed a bearish divergence before the recent drop.
Between December 9 and February 25, the MicroStrategy stock price formed a lower high, while RSI formed a higher high. This pattern signals weakening momentum because the price is rising without strong buying support.
This type of divergence often appears before major pullbacks. Similar divergences have appeared multiple times in recent months, and each one led to sharp corrections.
For example, a previous divergence completed in mid-Jan triggered a 45% crash, forming the major downtrend that still defines the stock’s broader structure.
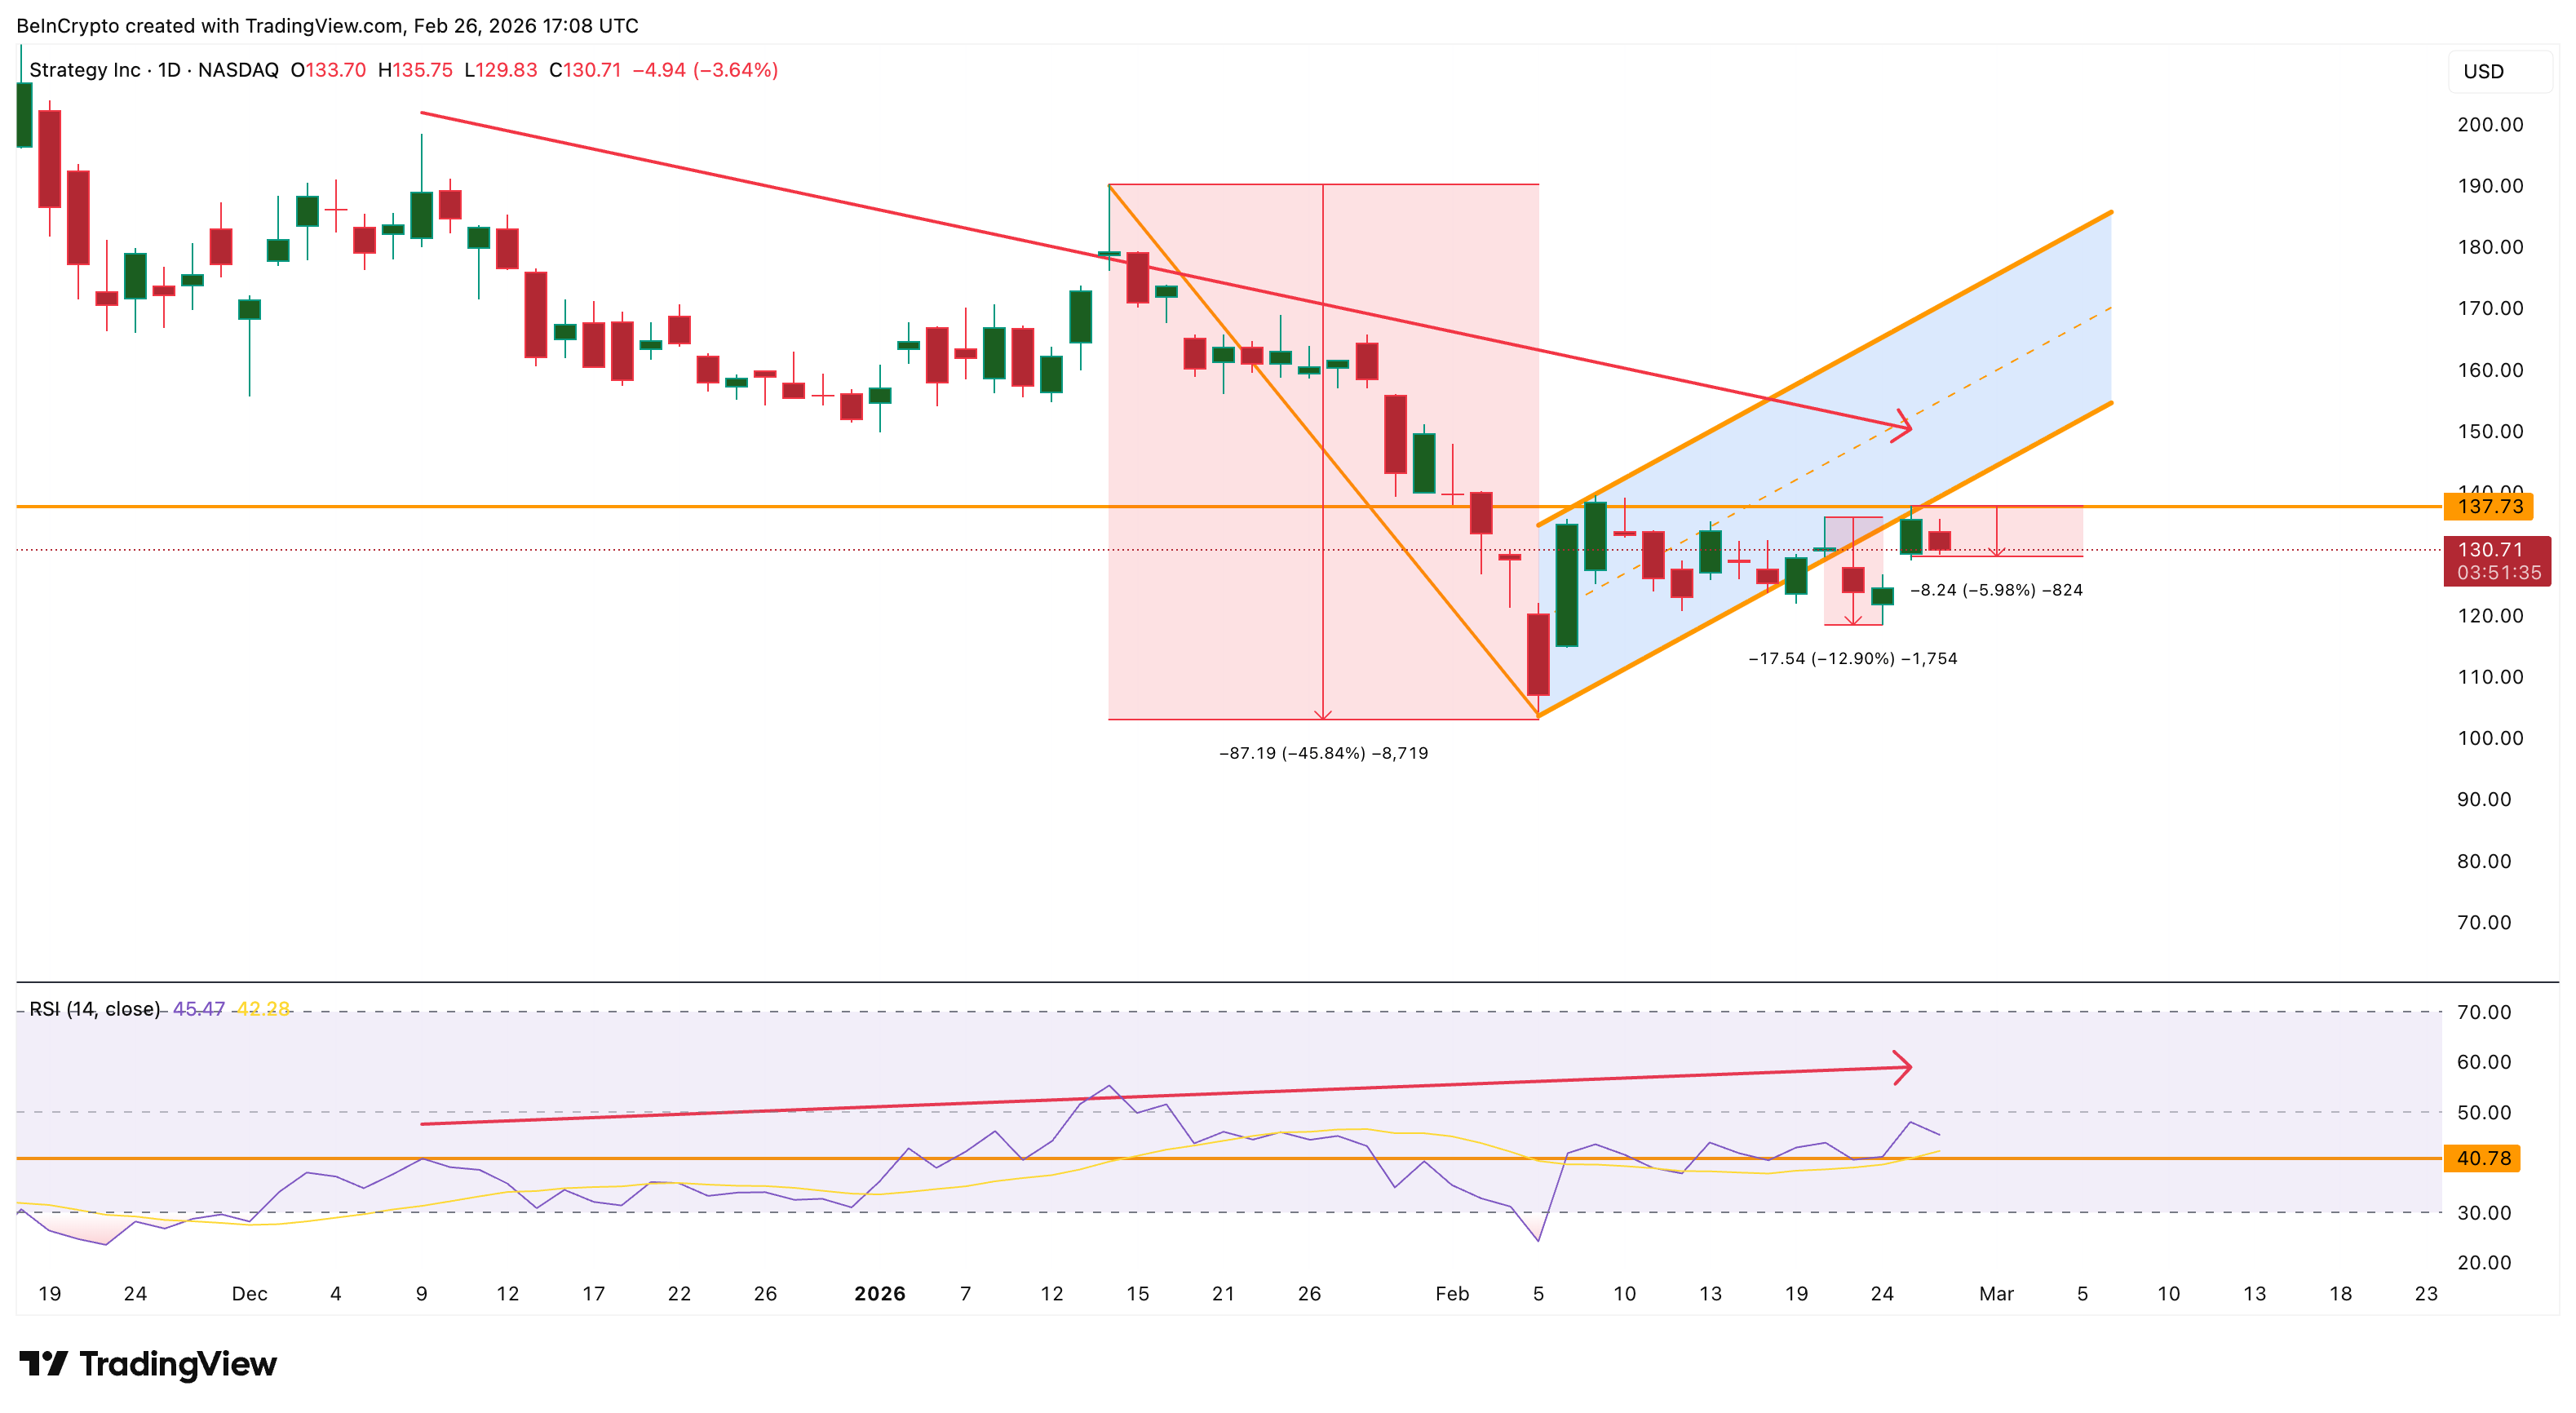
A recent one, concluding on February 20, led to a near 13% dip. The current one has already eaten into 6% of the gains, but because the broader bearish pattern remains active, this decline may be only the early stage of a larger move lower. That wouldn’t be great news for the MicroStrategy shareholders.
MicroStrategy Stock Price Breakdown Structure Points Toward $70
The MicroStrategy stock price has already broken below a bear flag pattern, which is a continuation pattern that forms during temporary rebounds inside larger downtrends. When this pattern breaks down, it usually leads to another strong leg lower.
Right now, the most important support level sits near $119. If this level fails, the next support appears near $106, followed by a stronger technical level near $85.
However, the full breakdown projection based on Fibonacci retracement levels points toward the $71 (the $70 zone) region, which aligns with the 0.786 Fibonacci level and pole’s projected 45%+ dip.
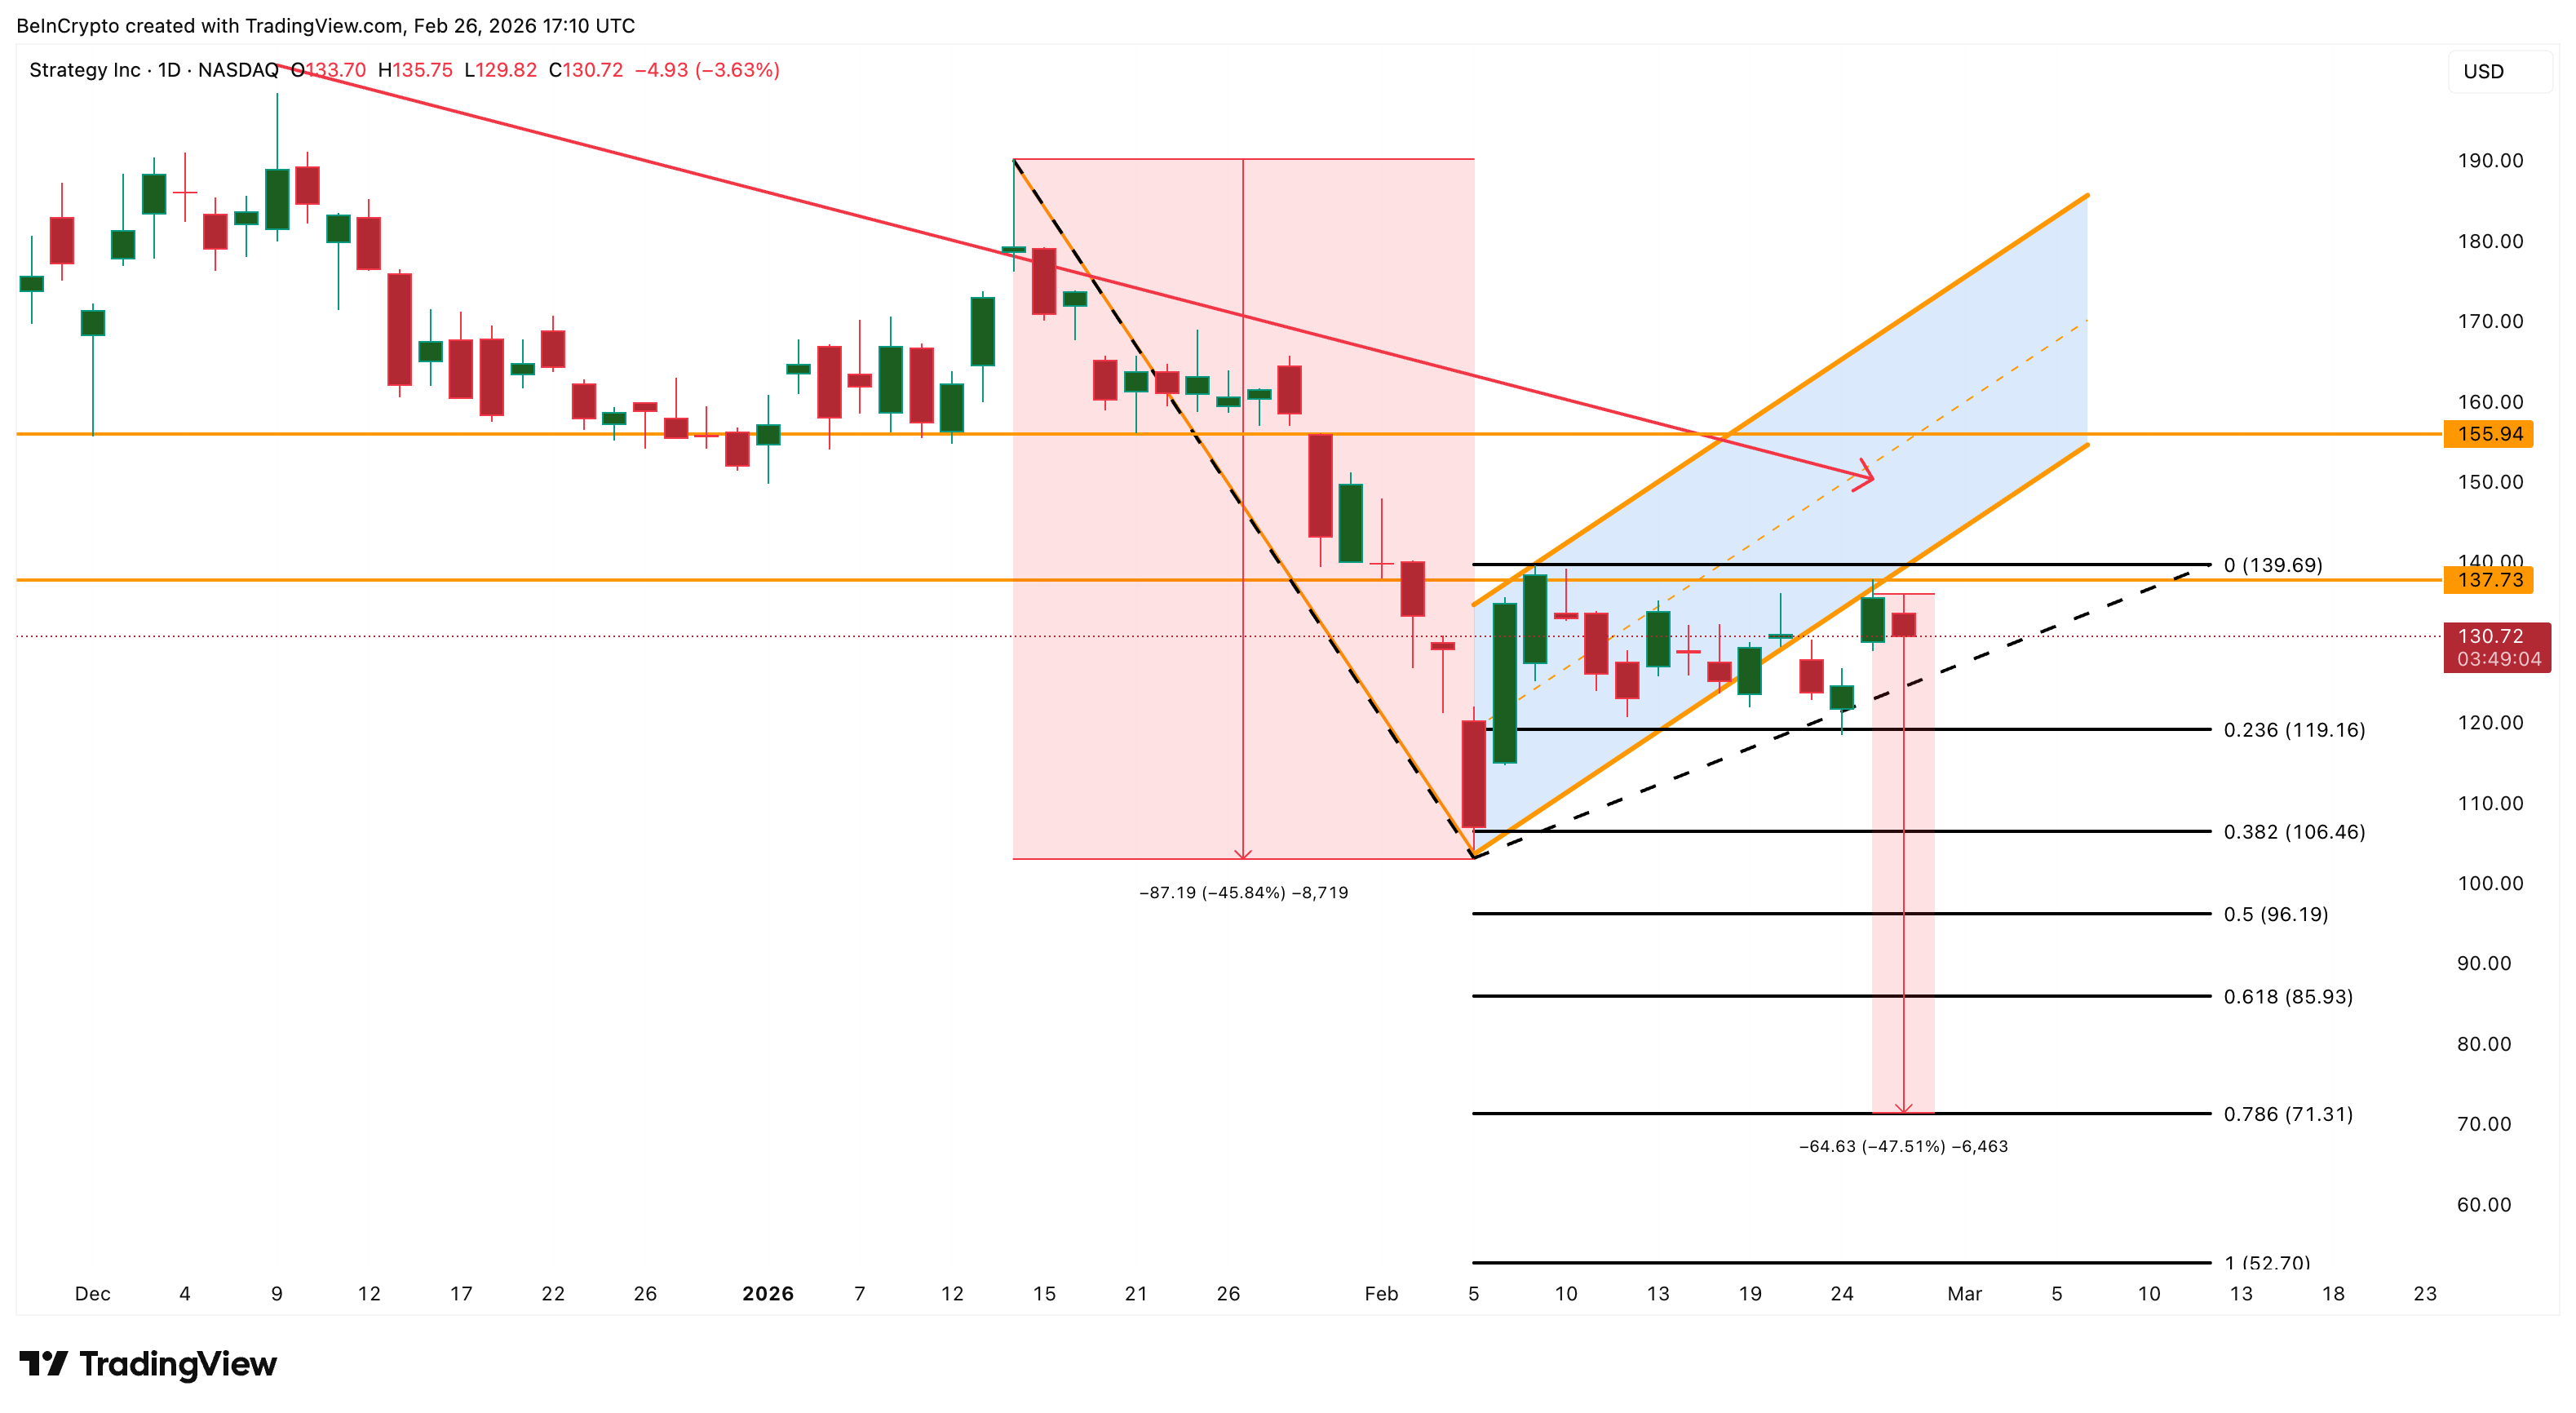
On the upside, the first sign of strength would only appear if MicroStrategy reclaims $139. However, the broader bearish structure would remain intact unless the stock breaks above $155, which would invalidate the breakdown pattern and signal a potential trend reversal.
Until those resistance levels are reclaimed, the current structure suggests MicroStrategy remains vulnerable to further downside, with the $70 zone now emerging as a realistic technical target if $85 gives way, given Bitcoin’s continued weakness.